eGFI - Dream Up the Future Sign-up for The Newsletter  For Teachers Online Store Contact us Search
Read the Magazine
What's New?
Explore eGFI
Engineer your Path About eGFI
Autodesk - Change Your World
Overview E-tube Trailblazers Student Blog
  • Tag Cloud

  • What’s New?

  • Pages

  • RSS RSS

  • RSS Comments

  • Archives

  • Meta

Building for Hurricanes

Activity adapted by NASA’s Precipitation Measurement Missions from PBS Design Squad activity High Rise. Click HERE for PDF of the activity and teacher’s guide or view online.

For similar design challenges involving lateral wind gusts, see TeachEngineering’s Recycled Towers [Grades 3-5] and Newspaper Tower [Grades 6-8] A similar PBS Design Squad activity using newspaper can be found HERE.

Summary

In this engineering design challenge about building in hurricane-prone regions, students learn that a solid base helps stabilize a structure by constructing, testing, and redesigning a tower that can support a tennis ball at least 18 inches off the ground while withstanding the wind from a fan.

Grade level: K-12

Time: 30 to 60 minutes

Learning objectives

After doing this activity, students should:

  • Understand that some shapes increase a building’s stability
  • Be able to follow the engineering design process to improve on a design
  • Identify which designs can and cannot withstand the self-weight of the tower as well as a lateral wind load.
  • Explain how their towers worked to withstand the lateral wind load using general engineering terms

Learning standards

Next Generation Science Standards

  • Define a simple design problem reflecting a need or a want that includes specified criteria for success and constraints on materials, time, or cost. (Grades 3 – 5)
  • Generate and compare multiple possible solutions to a problem based on how well each is likely to meet the criteria and constraints of the problem. (Grades 3 – 5)
  • Plan and carry out fair tests in which variables are controlled and failure points are considered to identify aspects of a model or prototype that can be improved. (Grades 3 – 5)
  • Evaluate competing design solutions using a systematic process to determine how well they meet the criteria and constraints of the problem. (Grades 6-8)
  • Analyze data from tests to determine similarities and differences among several design solutions to identify the best characteristics of each that can be combined into a new solution to better meet the criteria for success. (Grades 6 – 8)

International Technology and Engineering Educators Association

  • Identify and collect information about everyday problems that can be solved by technology, and generate ideas and requirements for solving a problem. (Grades 3 – 5)
  • Test and evaluate the solutions for the design problem. (Grades 3 – 5)
  • Design is a creative planning process that leads to useful products and systems. (Grades 6 – 8)
  • There is no perfect design. (Grades 6 – 8)
  • Requirements for design are made up of criteria and constraints. (Grades 6 – 8)
  • Design involves a set of steps, which can be performed in different sequences and repeated as needed. (Grades 6 – 8)D
  • Brainstorming is a group problem-solving design process in which each person in the group presents his or her ideas in an open forum. (Grades 6 – 8)
  • Modeling, testing, evaluating, and modifying are used to transform ideas into practical solutions. (Grades 6 – 8)
  • Test and evaluate the design in relation to pre-established requirements, such as criteria and constraints, and refine as needed. (Grades 6 – 8)
  • Structures rest on a foundation. (Grades 6 – 8)
Engineering connection

Students act as civil and structural engineers as they design and build towers to withstand the forces of high winds, such as might occur during storms and hurricanes.

Introduction/Motivation

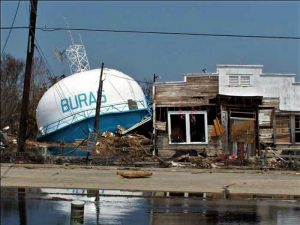
Whether you live in an area prone to hurricanes or not, you’ve seen images of the destruction caused by such storms. (Like the water tower that toppled in Louisiana during Hurricane Katrina.) In late August through early September 2017, Hurricane Harvey inundated Houston, Texas, dropping so much rainfall that maps had to be redesigned because the current system didn’t go high enough. Then Irma ripped through the  Caribbean, followed by Hurricane Maria’s category 5 fury that wreaked havoc in Puerto Rico.

Builders in areas at risk for hurricanes need to plan for that in their designs. That is the role you will take on today—designing a building that can withstand a (simulated) hurricane using limited supplies in a limited amount of time.

Damage to buildings can come because of wind, storm surge, or heavy rainfall leading to flooding. For today’s activity, we will focus primarily on wind damage, although you may choose to think about the  others as well. The tower must be as tall as you can make it, but also stable enough to stand up to a wind load since it will be built in a hurricane-prone region.

Engineers face similar design constraints in the real world—with tight budgets, material limitations and deadlines. An engineering team that can design a structure to meet the objectives with the fewest materials (hence, less cost), is favored over other companies that cannot utilize the given materials as effectively.

When you are brainstorming about your design approach in your teams, think about the real skyscrapers you have seen as inspiration, including the tallest buildings and towers in your home town. What are their shapes? What are their foundations like?


Challenge

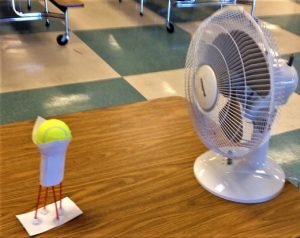
Your challenge is to build a freestanding tower that can support a tennis ball as high as possible off the ground (measured from the bottom of the tennis ball) while withstanding the wind from a fan. (Optional extra tough challenge: add a spray bottle to represent rain!)

Build a tower that can support a tennis ball at least 18 inches off the ground while withstanding the wind from a fan.

Materials

For each group:

  • Index cards (4-8)
  • Straws (~10)
  • Craft sticks (4-8)
  • String (~3 feet/~1 meter)
  • Pipe cleaners (4-8)
  • Tape (limited or unlimited amount – depending on level of challenge)
  • Optional: Building surface (tray, cardboard, or piece of wood)

To share:

  • Electric fan
  • Tennis ball
  • Scissors
  • Ruler
  • Capture sheet for planning and analysis of results (or just paper and pencil). Click HERE for PDF.
  • Optional: Spray bottle with water for testing
  • Copy of challenge instructions
  • Optional: Copy of tower/structure examples from PowerPoint. (optional)

Procedure  
Instructions, the challenge, and examples of structures are included in PowerPoint presentation. This could be projected on a screen, or a copy made for each group.

Introduce the challenge. Be sure to remind the students that the height of the tower is measured from the ground to the bottom of the tennis ball as specified in the directions. This prevents designs that sit the tennis ball on the ground and built a tower around it, which defeats part of the purpose of the design challenge: to support weight. Also, this means that antenna-like protuberances on the top won’t add to their height value.

You can choose to allow them to attach tape to the tennis ball or just rest it on or in the tower—just be sure to specify which ahead of time.

If you wish to make this a competition, here are a few possibilities for scoring:

  • With a single-speed fan, multiply the height of the tower (measured to the bottom of the tennis ball) times the amount of time the tower stands before collapsing or blowing over.
  • With a variable speed fan, you can start on the lowest speed and after a fixed period of time turn up the fan to the next level, then after the same length of time to the third level. The score could then be the level of the fan times the height times the amount of time withstood at the highest power the fan was on before the tower blew over or collapsed. For example, a tower that is 20 cm tall and stood for 15 seconds at level 2 (medium) power before collapsing would score 2 * 20 * 15 = 600 points.

For either of the above options, you will probably want to determine ahead of time a maximum amount of time you will leave the tower in front of the fan—say 30 to 45 seconds. If several towers achieve that maximum, the tallest one wins!

This is also an opportunity to discuss how there are often different ways to solve the same problem. Show examples of different structures and shapes the students might use when designing their tower. Examples can be found in the slides – including the Eiffel Tower, skyscrapers, and water towers – or the teacher can supply.

Once teams have decided on a design, have them build their towers. Save time at the end for students to share their designs and test with the fan – which can be observational or framed as a contest between teams.

Brainstorm

Divide into teams of two or three. Before you begin designing, brainstorm answers to the following questions. Record and sketch your ideas on a piece of paper or on the capture sheet.

  • Which combination of materials will make the tower as tall as possible (measured to the bottom of the tennis ball)?
  • What tower shapes could you use? Should your base be round? Square? Triangular?
  • Can you be creative about using the materials in an unexpected way?
  • How can you get the tower to be freestanding, not taped to the table, and yet not fall over?
  • Think about the forces on the tower, wind from the side and gravity pulling down. How you will build your tower to resist them?

As you brainstorm designs for your tower, think about other structures and how they stand up. For example, a tent combines flexible and rigid materials to make a frame and covering that can stand on its own.

Build, Test, Redesign

Once you’ve got a tower to test, put it one foot away from the fan.  See how your tower responds when you turn the fan speed on low.

If there is time after testing, redesign your tower based on what you learned from the testing. For example, if the tower tips over, the tennis ball won’t stay in place, or the weight of the tennis ball collapses the tower.to improve their performance, or simply discuss what worked well and what didn’t in their designs.

Activity Scaling

  • To make the challenge a bit easier, give each group a roll of tape and allow them to use as much as they’d like.
  • For older students, add a rain simulation rain with a spray bottle. (You may want to do the testing outside or put down plastic sheeting. Make sure to remind students that they will have to move their tower to the testing site, so it must not be taped to the table.)
  • For younger kids, allow more time and materials, and suggest some design ideas.
  • For high school students, allow less time and fewer materials.

Troubleshooting tips

  • For testing, ensure all towers are placed the same distance away from the fan—about a foot works well for most models.
  • Move the fan to the tower if the structure is hard to move.
  • Instead of tape, consider giving each group part of a sheet of sticky mailing labels. They are easier to have ready to hand out to multiple groups (such as in pre-made supply bins), and ensure that each group gets the same exact same quantity if you are framing it as a competition.
  • If students are struggling, consider allowing more time or providing more materials.
  • If students are struggling for design ideas, suggest they think about tall buildings they may have seen in cities or in their own towns that have cylindrical shapes or large foundations or triangular trusses for support. If necessary, suggest more specifics, such as the idea of rolling the paper for strength and/or using a triangular or wider base.

Additional Resources

Skyscraper Basics. Primer on tall buildings from PBS’s Building Big series includes a forensic engineering skyscraper challenge to investigate building collapses and leaning towers.

Weather and Climate Science Education.  Interactive water-cycle games, videos on a new multidimensional model for studying hurricanes. and other teaching resources from NASA’s Precipitation Measurement Missions.

Extreme Weather News. The latest on hurricane tracks, rainfall amounts, and other storm news from NASA’s Precipitation Measurement Missions.

NASA’s Hurricanes and Tropical Storms webpage. Thermal images, videos, and more.

Structure basics. TechnologyStudent.com has diagrams and examples of different types and parts of structures, such as struts and ties, sections and beams, and frames, as well as other building and design activities.

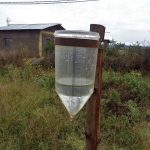
NASA’s Rain EnGAUGE weather activities include building and testing a rain gauge and the hurricane tower challenge.

Adapted from PBS Design Squad activity High Rise. Click HERE for original Design Squad activity in English and Leader/Teacher Guide. Click HERE for Spanish. A similar Design Squad activity using newspaper can be found HERE.

Backyard Weather Station


TeachEngineering activity is part of an Earth and Space Science and Technology curricular unit on weather and the atmosphere contributed by the University of Colorado, Boulder, College of Engineering’s Integrated Teaching and Learning Program.

Summary

Working in groups of 8, middle school students use their senses to describe what the weather is doing and predict what it might do next. After gaining a basic understanding of weather patterns, they act as state park engineers and design/build “backyard weather stations” to gather data to make actual weather forecasts.

Grade level: 6 to 8
Time: 180 minutes (One class period for Parts 1 and 2 for weather observations, one class period for building the weather station as a group, and one 50-minute class period to analyze and present weather station data.)

Learning Objectives

After this activity, students should be able to:

  • Observe and make predictions about the weather using their senses and observing the clouds.
  • Describe the relation between weather patterns and wind speed, air pressure, temperature, and precipitation.
  • Make a weather forecast based on sensory observations, cloud characteristics, and collected weather data.
  • Develop a model that describes how unequal heating of the Earth causes patterns of atmospheric and oceanic circulation that determine regional climates.

Learning Standards

NGSS: Next Generations Science Standards

MS-ESS2-6 Develop and use a model to describe how unequal heating and rotation of the Earth cause patterns of atmospheric and oceanic circulation that determine regional climates.

Common Core State Standards: Mathematics

  • Display numerical data in plots on a number line, including dot plots, histograms, and box plots. [Grade 6]
  • Understand that patterns of association can also be seen in bivariate categorical data by displaying frequencies and relative frequencies in a two-way table. Construct and interpret a two-way table summarizing data on two categorical variables collected from the same subjects. Use relative frequencies calculated for rows or columns to describe possible association between the two variables. [Grade 8]

International Technology and Engineering Educators Association: Technology

  • New products and systems can be developed to solve problems or to help do things that could not be done without the help of technology. [6-8]
  • Throughout history, new technologies have resulted from the demands, values, and interests of individuals, businesses, industries, and societies. [6-8]

Engineering Connection

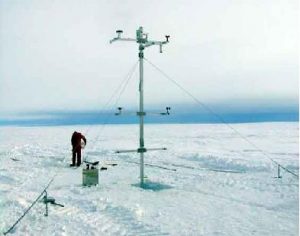
Who cares about the weather? A lot of people do, including engineers! Engineers have designed modern weather forecasting equipment, such as weather balloons, satellites, Doppler radar, and computer simulation programs to help meteorologists make accurate weather forecasts. Engineers have also designed the “automatic weather station” (AWS), which is used to collect weather data automatically in remote areas, such as the faraway mountains or the icy Antarctica. Often, mechanical engineers design and build the high-tech equipment that is used for weather forecasting. They also test the equipment to make sure that it is safe to use and can withstand severe atmospheric conditions. Electrical engineers also design the electronics and circuitry to measure and relay weather data accurately.

Materials

Each group needs:

Weather Tool #1: Wind Vane

Wind Vane Worksheet plus:

  • cardstock
  • pencil with eraser
  • pencils and markers
  • straight pen
  • scissors
  • small piece of modeling clay
  • hot glue
  • plastic straw
  • compass
  • piece of cardboard
Weather Tool #2: Barometer

Barometer Worksheet plus:

  • 2-liter plastic bottle
  • food coloring
  • clear plastic cup
  • water
  • marker
Weather Tool #3: Thermometer

Thermometer Worksheet plus

  • maximum/minimum thermometer
  • tape
  • climatology data for your area
Weather Tool #4: Rain Gauge 

Rain Gauge Worksheet plus

  • wide glass
  • masking tape
  • straight, thin jar (a graduated cylinder works best)
  • water
  • ruler

Introduction/Motivation

People have been forecasting the weather for thousands of years. Even you forecast the weather when you look out the window or step outside in the morning before deciding what to wear. In this case, you are using your senses to forecast the weather. You might be looking at the shape and color of the clouds in the sky, feeling how warm or cool the air is, or watching the trees to see if they are swaying in the breeze.

Modern weather forecasting is more complicated than using our senses to predict the weather — it really depends on the work of engineers and scientists. What are some of the engineering devices that are used today to forecast the weather? (Possible answers: Weather balloons, satellites, Doppler radars, computer programs, etc.) So, if engineers design this equipment, who uses it? Meteorologists and climatologists use these engineering devices to make weather forecasts. Everybody who plans a picnic, a camping trip, or rides on an airplane depends on these weather forecasts. For example, pilots need accurate weather forecasts to make air travel safe and comfortable for their passengers. Certain types of weather conditions, such as extremely high winds and severe thunderstorms, can make air travel unsafe. Greater accuracy in predicting the path and strengthn of a hurricane can help people stay safe. You might also need to know the weather if you are planning a camping trip — the wilderness is beautiful, but it can be dangerous to be caught outside in a storm.

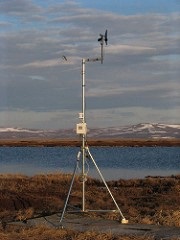
Now let’s try to imagine how people predicted the weather before engineers and scientists developed modern forecasting equipment (as shown in the photo, left, of an automatic weather station). How do you predict the weather? For example, when you see a clear blue sky on a warm day, what do you expect to happen? Probably not much — your experience of this weather pattern has taught you that clear blue skies on warm days mean fair weather. What if you looked up at the sky and saw a gray cloud, hanging low in the sky? You know from experience that dark gray clouds usually bring rain or snow. In both cases, you are relying on the observation of known patterns to predict the weather. Observing weather patterns over time to predict the future state of the weather is how people forecast the weather for thousands of years before engineers and scientists developed modern weather forecasting equipment.
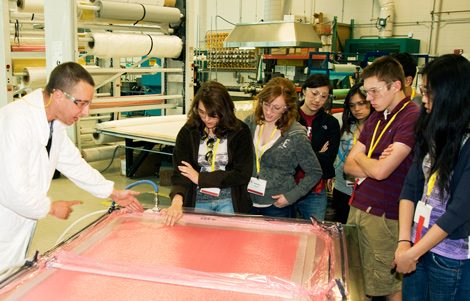
Today, you will be an engineer! You will use your senses to observe weather patterns and then design forecasting equipment to make a weather forecast. Let’s say that each one of you is working as an engineer for your State’s Parks Division. It is a holiday weekend, and a lot of people are planning to camp in the park. As a State Park engineer, it is your job to build a “backyard weather station” and make a weather forecast to determine whether the weekend will be safe and pleasant for camping. Let’s get started!

Procedure

See activity website for vocabulary and background information and graphics on air masses, weather fronts, and weather measuring tools on the TeachEngineering activity website.

Before the Activity

  • Gather materials and make copies of the worksheets.
  • Have the groups working with thermometers gather climatology data for their areas. Go to http://www.noaa.gov/ to access weather information.
  • To begin the activity, divide the class into groups of eight students.

With the Students

  1. Conduct one of the pre-activity assessment activities (see the Assessment section).
  2. Review the activity tasks and learning objectives.

  1. Give each student a Weather Forecasting Worksheet.

Part 1: Weather Observation Using our Senses

Note: This is a good time to take students outside. As a class, create a list of weather observations. Pay special attention to the color and shape of the clouds. Take this list back inside to help students draw pictures of the current weather state on their worksheets. Using these pictures, ask them to predict what they think the weather will do next.

Background Information

The most basic way to observe and make predictions about the weather is by using our senses. Sight is the easiest sense to use to forecast the weather. You can see when it is raining or snowing. You can see the different types of clouds in the sky. Touch is also an easy sense to use. When the sun is shining, you can feel it on your face. You can feel it become colder when a cloud blocks the sun. You can also use touch to sense how strong the wind is and from which directions it is blowing. Hearing helps us detect weather phenomena. When you hear thunder, you know a storm is nearby. You can hear wind blowing harder or softer through trees or as it whips around your ears. Smell can also help us predict the weather! Have you ever smelled the air before a rainstorm? It has a distinct smell. Snowstorms have a certain smell, too.

Part 2: Weather Forecasting Using Clouds

Explain that we can observe the shape, color and location of the clouds in the sky to make predictions about the weather. Have students draw pictures of each type of cloud on their worksheets and write short descriptions in the spaces provided. See the attached Forecasting with Clouds Reference Sheet for descriptions and pictures of these types.

Background Information

When clouds are in the sky, you can observe their shape, color and placement to predict what the weather will do. Different clouds help meteorologists tell what kind of weather is around them. We will consider cirrus, cumulus, altocumulus, nimbostratus and cumulonimbus types of clouds to help us predict the weather.

Note: If you are completing this activity over several class periods, this is a good place to stop and do the activity-embedded assessment (see the Assessment section).

Part 3: Building a Weather Station  

Background Information

Devices such as wind vanes, barometers, thermometers and rain gauges can help us observe the weather. Coupled with our sensory observations and knowledge of the clouds, we can make more accurate weather forecasts. Engineers have designed weather forecasting stations that can be built and operated almost anywhere on Earth. For example, engineers designed the “automatic weather station” (AWS), which is used to collect weather data automatically, saving human labor and enabling measurements from remote areas, such as Antarctica. These stations typically have a thermometer to measure temperature, an anemometer to measure wind, a hygrometer to measure humidity, a barometer to measure pressure. Some stations have a ceilometer, a device that uses a laser or other light source to determine the height of a cloud base.

We can engineer a weather station similar to an AWS to help us collect weather data. Our Backyard Weather Station will include a wind vane to observe the wind direction, a barometer to observe air pressure, a thermometer to record the air temperature and a rain gauge to measure any rainfall.

  1. Divide the class into their Backyard Weather Station groups (eight students per group) and have them agree upon a team name.
  2. Briefly describe each of the tools that will be used to build a Backyard Weather Station (wind vane, barometer, thermometer and rain gauge). Explain what each tool does and how it will help the students understand what the weather is doing.
  3. Within their groups of eight, have students forms pairs and decide which tool they would like to use.
  4. Give each pair the corresponding Weather Tool instructions worksheet.
  5. Have each pair review the list of the materials they need. Group need sturdy containers for their Backyard Weather Stations. Wooden crates or plastic tubs work well. Students can often find or borrow suitable containers at/from home.
  6. Help students gather materials and begin working on their weather tools.
  7. Give each pair time to test their weather tool, take data, and complete their Weather Tool worksheets.
  8. Have the pairs come together in their larger groups to design, test and finalize the configuration of their Backyard Weather Stations. (Note: It is suggested that the group with the thermometers also start to design the box or crate for the final weather station.)
  9. Have each group take data over a period of time. (Note: It is suggested that students take data for at least a few days.)

Part 4: Putting it all Together

Background Information

Now that we have engineered our weather stations and collected data, we can make a weather forecast. When we combine the information about wind direction, pressure, temperature and precipitation, we can predict the onset of large weather systems, such as weather fronts, which are caused by the movement of air masses.

  1. After sufficient weather data has been collected, have students complete the Weather Station Worksheet. Each group will make a detailed weather forecast using the weather data obtained from their Backyard Weather Stations.
  2. Have each team present their weather forecasts to the rest of the class.

Troubleshooting Tips

  • The activity is most effective if weather data can be collected at the same time each day for at least a few days.
  • For consistent weather data, locate the Backyard Weather Station in roughly the same place.
  • For more interesting results and discussion, lead this activity during periods when stormier weather is expected.

Investigating Questions

  1. What information do people look for in a weather forecast? (Possible answers: Air temperature maximum and minimum, chance of rain, snow or storms, gusty winds.)
  2. Where can we find weather forecasts? (Possible answers: Newspaper, television, radio, Internet.)
  3. How do weather forecasts help people? (Possible answers: Forecasting the weather helps us plan activities such as sporting events, picnics and vacations. Understanding what the weather is doing can prevent people from getting hurt in natural hazards such as floods, hurricanes and tornadoes.)

Assessment

Pre-Activity Assessment

Discussion: Have students discuss what kind of information they expect to find in a weather forecast. What kind of information would they want to gather to make a weather forecast? (Answer: A typical forecast contains information about the current weather conditions. Usually, it describes the temperature, the overall conditions [that is., rainy, sunny, cloudy, windy, stormy, etc.]. The wind speed is typically given in miles per hour [mph], and the visibility is given in miles. The barometric pressure [air pressure[ is reported, along with information about whether the barometric pressure is rising or falling. Finally, most weather forecasts provide a week-long forecast outlining the daily temperatures and chance of rain or sun. See the Investigating Questions sections for other leading questions.)

Review for Prior Knowledge: Give small groups of students a printout of the day’s weather forecast. Ask the students to interpret the information, and have each group explain one portion of the forecast to the rest of the class.

Activity-Embedded Assessment

Basic Weather Forecast: Have students make weather forecasts using their sensory observations and knowledge of the clouds. For these basic weather forecasts, have them predict if the weather is going to change or stay the same. Do they predict that it is going to become colder or warmer? Is it going to rain or snow? Is it going to become windy? This could be done in class or as a homework assignment. Share and compare the students’ basic weather forecasts as a class. Reiterate how sensory weather observation and prediction is easy to do, but it is not always dependable. As State Park engineers, we want to make a more accurate forecast using weather forecasting tools.

Post-Activity Assessment

Detailed Weather Forecast: Using the weather data collected over a period of time from each Backyard Weather Station, have each group put together a detailed weather forecast. This forecast could include the observed patterns in cloud shape, air temperature, wind direction, air pressure and precipitation. Also, did they observe any weather fronts? As State Park engineers, what is their final recommendation to the visitors coming to the park this weekend? Will it be pleasant or stormy? Will it be dangerous for the visitors? What precautions should visitors take?

Weather Presentations: Give students the opportunity to choose how to present their forecast to the class. Some ideas – a newspaper report, a poster showing the relevant weather features (wind direction, precipitation, cloud shape, presence of a weather front, etc.), a typical weather forecast on a “blue board” using props for sun, rain, clouds, warm fronts and cold fronts.

Activity Extensions

  • Have students enhance their weather stations with anemometers to measure wind speed and hygrometers to measure humidity.
  • Have students follow the weather forecasts from the newspaper or internet while they are using their Backyard Weather Stations to predict the weather. Have them compare how similar their forecasts are to the published professional weather forecasts.
  • Have student draw a flow model that incorporates the information they have learned about how atmospheric and oceanic circulation drives regional climate. [For example, the diagram could include the Sun heating a portion of atmosphere or ocean, changing pressure, and arrows indicating the movement of either ocean or water. Students could include either atmosphere or ocean or both.]

Activity Scaling

  • For younger students, put together a sample Backyard Weather Station to use as a class.
  • Lead younger students through Parts 1 and 2 of this activity to explain what the weather is doing based on their senses and knowledge of the clouds. As a class, make a weather forecast using a completed Backyard Weather Station.
  • For older students, have them collect weather data over a longer period of time to generate a more detailed weather forecast report.

Related middle-school activities:

  • Weather Basics (15 min. TeachEngineering activity on factors that effect weather, cloud formation, and instruments to measure weather.)
  • Weather Forecasting (20 min. TeachEngineering activity on forecasting technologies and how improvements have helped save lives.)
  • Stormy Skies (15 min. TeachEngineering activity covers basics of high and low pressure, air masses, and how engineers help improve forecasts.)

References

Australian Government Antarctic Division, Experience Antarctica, This Week In Antarctica, TWIA archives, TWIA archive 2003, Early TWIAs, “Casey Autumn Traverse,” October 23, 2007.

Detroit Public TV, Get Up! Get Out!, “Activity Ideas – Backyard Weather Station.”

Short, Nicholas M. NASA Education LandSat Remote Sensing Tutorial, “Atmospheric Circulation; Weather Systems.”

Additional resources

Build an Anemometer. TeachEngineering YouTube video on how to build a wind gauge using paper cups and straws.

Build a Simple Weather Station: Part 1, Rain Gauge. WonderStruck YouTube video on constructing a rain gauge from an empty plastic bottle.

Build a Simple Weather Station: Part 2, Barometer; Part 3, Weather Vane; Part 4, Anemometer 

Severe Weather 101.  The National Oceanic and Atmospheric Administration’s Severe Storms Laboratory includes weather education resources for teachers and students, including links to the international cloud atlas and cloud-viewing guide, and  “Weather Friends” superhero trading cards.

Contributors

Lauren Cooper; Malinda Schaefer Zarske; Janet Yowell

Copyright

© 2007 by Regents of the University of Colorado

Supporting Program

Integrated Teaching and Learning Program, College of Engineering, University of Colorado Boulder, which developed TeachEngineering’s digital library curricula under National Science Foundation GK-12 grant no. 0338326.

Paid Summer Program for HS Students

Applications are now open for the Science and Engineering Apprenticeship Program (SEAP), a paid summer research program for high school students administered by the American Society for Engineering Education.

Sophomores, juniors, and seniors are selected to spend eight weeks working alongside professional engineers and research scientists on real projects at one of 25 Department of Navy labs around the country.  

New interns receive stipends of $3,300, returning interns receive $3,800 for the summer. (Note: Stipend does NOT cover transportation, lodging, and living expenses.)

The goals of SEAP are to encourage participating students to pursue science and engineering careers, to further their education via mentoring by laboratory personnel and their participation in research, and to make them aware of the Navy’s research and technology efforts, which can lead to employment within the Department.

In summer 2017, SEAPSEAP 2015 provided competitive research internships to over 294 high school students.

Check your eligibility and apply HERE. Applications – which include grade transcripts and letters of recommendation – are due October 31, 2017, at 6 p.m. EST.

Location, Location, Location

The clear skies above Hawaii’s Mauna Kea make the site ideal for a giant telescope. That’s assuming engineers can shield it from earthquakes, fierce winds, and extreme temperatures.

This blog post is excerpted from an article by Pierre Home-Douglas in the October 2015 issue of ASEE’s Prism magazine. Click HERE to read the full article.

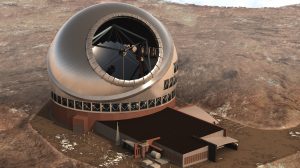
Scheduled to open — or, in astronomer parlance, “see first light” — in 2024, the $1.4 billion Thirty Meter Telescope on Hawaii’s Mauna Kea will be the largest in the world. Its mosaic-like network of hexagonal mirrors, operating in concert, will form the equivalent of a 100-foot-diameter mirror. An unprecedented light-gathering ability — more than 140 times than that of the Hubble Space Telescope — will enable astronomers to look back more than 13 billion years in space, as close as humans have ever come to witnessing the immediate aftermath of the Big Bang. Yet while most eyes will no doubt be trained on the TMT and the stunning images it captures, engineers will be gazing in wonder at the structure that houses it: a 20-story-high marvel of design and the most advanced observatory in the world.

Building an enclosure for a large telescope is never a simple proposition. The telescope itself is a delicate instrument; it has to be able to track stars and other stellar bodies with unparalleled precision as they appear to travel through the night sky; a slight force or breeze can knock it off track; and any difference in temperature between the enclosure and the ambient air outside will degrade its optical performance. The role of the dome is central to TMT’s success. Jerry Nelson, the University of California, Santa Cruz astronomer who pioneered the signature segmented mirrors on the Keck telescopes — also on Mauna Kea — flatly states, “The telescope doesn’t work if the dome doesn’t work.”


Earthquake protection

In the case of TMT, the challenges are compounded by the location of the observatory. Ye Zhou, president of the dome’s designer and builder, Dynamic Structures of British Columbia, Canada, describes TMT’s site as “the worst of the worst”: a few hundred feet below the 13,796-foot summit of the dormant volcano. The skies above the site are some of the clearest in the world, with virtually no light pollution. “But it’s also an active seismic zone,” Zhou states. “We have to design it to survive a once-in-a-thousand-year earthquake. It also has to be able to return to service within two weeks from a once-in-200-year earthquake.” And then there are the winds. The telescope has to be capable of operating in winds as strong as 100 kilometers an hour (62 mph) and the observatory tough enough to withstand blasts three times greater.

The sturdiness of the $150 million building will come partly from its shape: a spherical dome designed to deflect winds. To minimize the effects of earthquakes, TMT will feature lateral guides distributed along the perimeter of the dome with multiple “fuse elements.” These are structural components such as girders, beams, and trusses strategically placed in the structure that, in the event of an earthquake, can deform or even break, dissipating some of the seismic energy, and still leave the building relatively unscathed. They are also situated so they can easily be replaced in the event they are destroyed. Shock absorbers installed under certain components will also cushion the impact of any excessive ground shake.

There is a balancing act here. The structure needs to be rigid enough for regular operation of the telescope but flexible, or malleable, enough that an earthquake will not cause it to collapse. Zhou says the dome’s design will eschew super-strong metals, as these tend to be brittle. Instead, designers will rely on the regular high-strength steel used in bridges and high-rise buildings.

Another challenge on Mauna Kea is the temperature extremes, which can vary from minus 20 degrees Celsius (minus 68 degrees Fahrenheit) to plus 40. This might not pose a problem if the observatory housed something conventional, but a telescope is anything but a regular piece of machinery. Temperatures inside and outside the structure must match as close as possible. TMT’s dome is equipped with 98 vents around the building that can be opened to provide adequate ventilation.

In addition, the opening for the telescope in the dome has a series of 4-by-5-meter aperture flaps or “eyelashes”— aluminum fins that can control the air flow over the dome and reduce gusts from buffeting the delicate alignment of the telescope mirrors, which feature a network of supports and actuators underneath each segment that control the deflection caused by gravity on the glass and maintain the overall perfect parabolic shape down to the micron level.

Further complicating construction: the mountain is a sacred site. Protesters succeeded in getting the courts to revoke permits, though the project got a green light again in July 2017.


Quick-closing shutter

The circular opening that allows the telescope to peer out of its mountain-top aerie is only a meter wider than the total mirror diameter, which will minimize the effects of winds on the telescope. Typically, large telescopes like the 10-meter Keck 1 and 2 telescopes use garage-door-like shutters weighing 50 tons or more that move up and down. The sheer size of TMT would require even larger doors, and motors with thousands of horsepower to move them. That would come with a high price tag for electricity in such a remote spot, not to mention the cost of the motors themselves.

Another unique design element is how TMT can move in two directions simultaneously. The base rotates on a horizontal track; the top half — the cap — is inclined and rotates at a 32-degree angle. Both motions will enable the telescope to point anywhere from vertical to 65 degrees down towards the horizon. [Click HERE for “Grace Under Pressure” and latest drawings of rotating dome.] “Most big structures like bridges and dams are static,” Zhou points out. “But this one has two parts that need to move at the same time — and they have to do it extremely precisely, smoothly, and with great reliability.” That will be accomplished with an inclined track and a series of 24 custom-designed bogies riding on a rail somewhat like a roller coaster track.

Dynamic Structures already has experience with inclined tracks through its entertainment division, which has designed a host of theme park rides, including Universal Studios’ Harry Potter and the Forbidden Journey ride. One of the main differences between the rails for a telescope and a roller coaster, however, is the weight. Roller coaster cars weigh only a few tons, but TMT’s cap weighs more than 800 tons.

Astronomers around the world are relying on the synergy of the Dynamic Structures team. “After the Big Bang, the universe cooled for several hundred thousand years until the first stars were formed,” Carlsberg explains. “We don’t know much about them. They are different from the stars today because they were formed only out of hydrogen and helium, unlike current stars that have other elements, such as carbon, nitrogen, and oxygen. With TMT we’ll be able to see them for the first time. We’ll be looking back literally to the first light.”

Build a Cereal Box Eclipse Viewer


NASA activity adapted from Hila Science Camp in Ontario, Canada. It can be done in class or as an after-school, community, or family activity. Click here for classroom version, which includes learning standards and links to knowledge about eclipses.

Time: 20 minutes

Grade level: PreK-12

During a solar eclipse, it is very tempting to look directly at the sun as the moon moves across it, blocking out its light. But doing so is very dangerous and can result in permanent eye damage after just a few seconds.

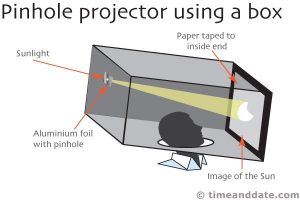
You can protect your eyes and see the entire event by watching a projected image of the sun using a pin-hole projector.

Like the old-fashioned box cameras, pin-hole viewers have a tiny aperture, or opening, that acts much like a lens, creating an image on the back of the box much like the retina at the back of the eye.

A cereal box makes an excellent pinhole viewer, though any box will do.

Take breaks and look around you during the eclipse, advises the American Astronomical Society‘s guide to the experience. As the sun dwindles, shadows become sharper – to the point where you can see the hairs on your arm. The feeble light just before and after totality also creates beautiful, 360-degree sunset colors on the horizon.
Learning Standards  

Next Generation Science Standards

  • ESS1.B: Earth and the Solar System The solar system consists of the sun and a collection of objects, including planets, their moons, and asteroids that are held in orbit around the sun by its gravitational pull on them.
  • MS-ESS1-3 This model of the solar system can explain eclipses of the sun and the moon. Earth’s spin axis is fixed in direction over the short-term but tilted relative to its orbit around the sun.

Materials 

  • Empty cereal box – one per student
  • White or colored paper
  • Aluminum foil
  • Tape
  • Scissors
  • Pin, thumb tack, or toothpick to poke hole

Procedure

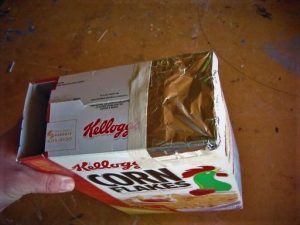
  1. Viewing screen. Trace the bottom of the cereal box on a piece of white paper, cut out the shape, and tape it inside the bottom of box and seal the top.
  2. Viewer. Cut rectangular holes (about 1 inch from each edge, according to this short how-to video by University of Central Florida astronomy students) on the left and right side of the cereal box top.
  3. Lens. Cut a piece of aluminum foil to cover the left hole. Tape the foil in place.
  4. Poke a pinhole in the center of the foil.
  5. With the sun BEHIND you, look into the right hole.
  6. Watch a projection of the eclipse on the paper at the bottom of your viewer!

Extra credit: Cover the outside of the box with paper and decorate.

Note: Cereal boxes project a small, 3 mm image, but are easier for younger children to handle. A large box or long packing tube will project a bigger image.

Other DIY methods for building sun viewers: 

  • Skip the box! NASA’s Jet Propulsion Lab shows how to make a pinhole projector from a piece of paper and foil.
  • This video from the San Francisco Exploratorium shows how to use binoculars on a tripod to focus an image of the sun on a large white cardboard screen for safe viewing. Another video shows Exploratorium physicist Paul Doherty making a similar sun viewer using a tripod-mounted monocular (spyglass) and cardboard.
  • Chips-o-Scope. Using the same principles as the cereal box pinhole viewer, this AReResearch video shows how to transform a Pringles potato chip container into an eclipse viewer that several people can watch at the same time.
  • No tools to tackle a Pringles package? The University of Illinois shows how to turn a cardboard tube into a pinhole viewer.
  • Walmart’s summer eclipse lesson has instructions for both cereal box and potato chip tube viewers.
  • 3D print a pinhole projector or make a 2-D model with your state and totality path using downloadable files from NASA.
  • Room cameras and other ideas from pinholephotography.org.
  • Not in the path of totality or unable to experience the eclipse?  NASA’s main TV channel plans livestream “Eclipse Across America” broadcasts from 12 different locations on the ground, jets in the sky, telescopes, and dozens of high-altitude balloons. Feeds are scheduled to run from noon to 4 p.m. EDT.
  • NASA’s Jet Propulsion Lab also offers an online web-based simulation.

Beware of unsafe eclipse-viewing “glasses” – especially DIY models that use exposed film. Check out the American Astronomical Society’s guide for how to tell if your eclipse glasses or handheld viewers are safe.

Eclipse 101: What, Where, How?

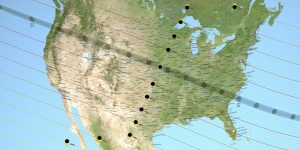
On Monday, August 21, 2017, all of North America will be treated to an eclipse of the sun. Anyone within the path of totality – when the moon will completely cover the sun and its tenuous atmosphere, the corona – can experience one of nature’s most inspiring, albeit fleeting, events. At its longest, in parts of southern Illinois and Kentucky, totality will last just 2 minutes and 40 seconds.

As the above NASA animation shows, the moon’s full shadow will streak at 2,000 m.p.h. across a broad swath of the United States, starting from from Lincoln Beach, Oregon,around 9:15 a.m. Pacific time and wrapping up in Charleston, South Carolina, around 4 p.m. Eastern time. Along the way, as the Washington Post’s Michael Ruane writes, it will plunge such diverse areas of the country as extinct Idaho volcanoes and downtown Kansas City into total darkness. Click HERE for a list of cities in the path of totality.

The U.S. space agency has assembled a helpful guide for experiencing the the eclipse, from where and when totality will occur to tips for safe viewing and list of EVENTS.  The Washington Post, which is publishing Eclipse Day weather forecasts, offers a rundown of what to expect in the 90 minutes leading up to totality… and top pop culture eclipse moments. (Think Bugs Bunny reenacting Mark Twain’s classic Connecticut Yankee in King Arthur’s Court.)

NASA’s comprehensive Eclipse 101 site includes a history of eclipses, a primer on how eclipses work, downloadable maps, and activities – such as “citizen explorer” projects to measure the temperature at totality or art projects like taking videos of yourself dancing in the moon’s shadow at totality. There’s also a site for educators that features a downloadable Eclipse Kit with instructions for making a safe viewing device out of a cereal box and other activities.

Can’t experience the eclipse first hand? NASA’s got you covered with interactive, 3-D web simulations and live streaming broadcasts from 12 sites and even aircraft. Tune in from noon to 4 p.m. EDT.

Astrophysicist Neil deGrasse Tyson offers this piece of advice: Put down your phone and watch the eclipse, don’t photograph it! Don’t look at the sun directly, however, or through exposed film or other homemade glasses. A few seconds of quick glances can cause permanent eye damage. Click HERE for more on eye safety.

Elementary Special Ed Engineering Pilot


Engineering is Elementary is developing resources to increase EiE’s accessibility for students who receive special education services and/or are English Learners and seeks teachers who already have taught EiE to pilot the materials and provide feedback.

These resources include: visual vocabulary cards, a suggested pacing guide, simplified student handouts, differentiation tips for ELL students, discussion supports, and visual Engineering Design Process posters.

The resources will be piloted for the following units:

  1. A Work in Process: Improving a Play Dough Process
  2. Just Passing Through: Designing Model Membranes
  3. Thinking Inside the Box: Designing Plant Packages
  4. Solid as a Rock: Replicating an Artifact
  5. Marvelous Machines: Making Work Easier
  6. Sounds Like Fun: Seeing Animal Sounds
  7. Taking the Plunge: Designing Submersibles
  8. A Sticky Situation: Designing Walls

If chosen to participate, teachers will receive the materials kit, teacher guide, and resources for one of the units above at no cost as well as a $350 stipend for their feedback.

Who should apply?

We are looking for teachers who have already taught EiE in the past. Pilot teachers will teach the unit to all of the students in their classroom using the newly developed resources. Pilot classrooms must contain some students who receive special education services and/or are ELs, but the classrooms do not need to be predominately made of these student populations.

What are we asking you to do?

  • Implement all resources as close to written/instructed as possible.
  • Complete online feedback forms after teaching each EiE lesson to reflect on how well these resources are working for your students.
  • Finish teaching the unit by December 15th, 2017.
  • Pilot sites in Massachusetts may be asked to attend a focus group at the Museum of Science, Boston. Additional compensation would be provided.

This EiE pilot application will close at 5 PM on Friday, September 1! If you have any questions, please email nmeyer@mos.org.

Solar Geometry

This lesson was developed by architectural engineer Tony Esposito, Ph.D., during his graduate studies at Pennsylvania State University and made available to eGFI Teachers. The sun’s position is one of the factors that lighting engineers like Tony take into account when designing buildings, including solar homes.

Note: This lesson applies verbatim only to the northern hemisphere, but inferences can be made about the southern hemisphere.

For other eclipse-related math activities, see NASA’s Citizen Explorer’s site, which includes downloadable activities such as calculating the moon’s distance and speed of its shadow crossing Earth.

Summary

Middle school students learn about the Earth’s geometrical relation to the sun by calculating where the sun will be in the sky for any date or time given a particular location on Earth, such as their school.

Grade Level: 8th grade (complexity and computational requirements can be scaled down for lower grades)

Time: 3 periods of 50 minutes

Learning Outcomes:

After this lesson, students will understand:

  • The geometric relationship between Earth and the sun
  • Earth’s rotation
  • How Earth’s axial tilt affects the Earth
  • How time is quantified on Earth
  • How position (location) is quantified on Earth
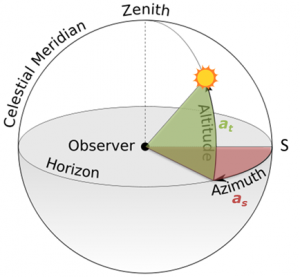
  • How to quantitatively predict the location of the sun in the sky

Learning Standards

Next Generation Science Standards

Earth’s Place in the Universe – Grade 5

  • Represent data in graphical displays to reveal patterns of daily changes in length and direction of shadows, day and night, and the seasonal appearance of some stars in the night sky.

Earth’s Place in the Universe and Earth’s Systems – Grades 6 to 8

  • Develop and use a model of the Earth-sun-moon system to describe the cyclic patterns of lunar phases, eclipses of the sun and moon, and seasons.
  • Develop a model to describe the cycling of Earth’s materials and the flow of energy that drives this process

Common Core State Mathematics Standards

Geometry – Grades 6 to 8

  • Solve real-life and mathematical problems involving angle measure, area, surface area, and volume.

Engineering Connection

Knowing the sun’s position in relationship to Earth is one factor that engineers take into account when designing buildings to maximize natural light or heat. With solar power becoming popular, engineers are needed who understand how to position photovolataic panels to get maximum power. Instruments that can pinpoint Naval engineers

Attachments: 

  • Solar Geometry presentation.ppt [PowerPoint] Contains the major content of the course and can be used directly as a presentation or as reference material to accompany your own teaching methods.
  • Solar Geometry presentation narrative [PDF] Contains discussion topics, resources, and reference material for each of the slides.
  • Solar Geometry presentation notes [PDF] includes suggested videos and guide to each activity.
  • Worksheets (use or modify as you wish):
    • Section 1 (.docx) – Various definitions and questions on rotation and axial tilt. Click for ANSWER KEY.
    • Section 2 (.docx) – Various definitions and questions about latitude, longitude, and geographical location. Click for ANSWER KEY.
    • Section 3 (.docx) – Calculate solar angles. Click for ANSWER KEY.
  • Quizzes:
    • Quiz template (blank form has lesson name and space for date and student’s name)
  • Activities:


Activities

Please refer to the Solar Geometry presentation narrative and presentation notes, or presentation.ppt for illustrations, student prompts, vocabulary, sample calculations, and background information on such foundational concepts as latitude and longitude that students should explore before tackling the activities, plus suggested for videos and discussion topics. 

Encourage the students to pay close attention to the videos and form their own questions about the topics presented. Additionally, it may be helpful to have students review the worksheet before watching the video or doing the activity to anticipate the information to pay particular attention to.

Activity 1 – Understanding Earth’s Relationship to the Sun

Discuss with students what they know about Earth’s orbit around the sun, rotation around its own axis, tilt relative to the sun, and causes of seasons. Encourage them  to begin to think about the geometry between our planet and sun as Earth orbits around the sun and rotates about its own (tilted) axis.

Suggested videos:

Guiding questions: In which direction does the Earth orbit the sun? In which direction does the Earth rotate about its own axis? What is the Earth’s axial tilt (relative to its orbital plane)? What causes the seasons? How does time of year effect length of day? How do we technically define year, day, and hour?

Activity: 

  • Draw (in overhead of “plan” view) the earth’s position in relation to the sun during the following four times of the year and indicate their Julian Day:
    • June 22 (Summer Solstice)
    • September 23 (Autumnal Equinox)
    • December 22 (Winter Solstice)
    • March 21 (Vernal Equinox)
    Additionally, indicate the Earths orbital position on your birthday and calculate the Julian Day for your birthday! [Julian Days run from Day 1 (January 1) to 365 (December 31), with each day assigned a whole number integer corresponding to where it falls chronologically on the calendar throughout the year. For example, March 23 = 31 (total days in January) + 28 (total days in February) + 23 (March) = 82.]

For additional help, see Moonstick.com’s positions of the moon.

Activity 2 – Quantifying Time and Position on Earth 

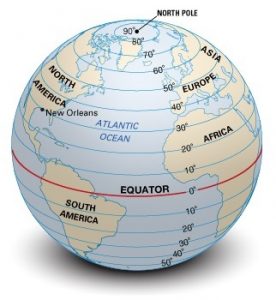
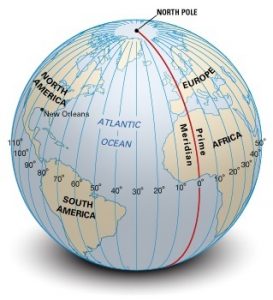
Together, longitude and latitude form a coordinate system to quickly and easily identify a position on Earth. The goal of this activity is to familiarize students with using longitude and latitude to locate places on Earth.

Suggested Videos:

Activity:

  • Using a map above, answer the following questions:
  • Which continent is located at 40° N, 100° W?
  • Which continent is located at 30° N, 100° E?
  • Which continent is located at 20° S, 50° W?
  • Which country is located at +60.0°, +120.0°?
  • Which ocean is located at -50.0°, -140.0°?

Activity 3 – Predicting shadow length from solar angles

In this activity, students will demonstrate their understanding of longitude and latitude by finding geographical coordinates for specified places and drawing their location on a diagram indicating the appropriate coordinates.

  1. Measure an outside object, such as a fence pole, fire hydrant, slide, or stick. If needed, you can construct an item or use one from your classroom.
  2. Using the solar angles from their worksheet calculations, have students predict the shadow of that outside object.

Hint: make sure you perform the measurement at the same time and date as your calculations.

Troubleshooting tips:

  • Note that longitude and latitude can be expressed as fractional degrees or in terms of “minutes” and “seconds.” For simplicity, stick with fractional degrees as this is the easiest format to understand when converting “minutes” and “seconds” to fractional degrees.
  • So students can prepare for this activity, assign it about a week after doing the worksheet on calculating solar time, solar altitude, and solar azimuth. For added problems, watch the following video on finding longitude and latitude:


Additional Resources

Books

Longitude: The True Story of a Lone Genius Who Solved the Greatest Scientific Problem of His Time, by Dava Sobel. An illustrated version supplements the 1995 text with 178 images depicting the how a clockmaker named John Harrison invented a truly reliable chronometer and gave rise to Britain’s dominance of the seas while changing the world’s concept of time.

Websites

Stellarium A free, open-source planetarium for your computer similar to ones being used in planetarium projectors. It shows a realistic sky in 3D, just like what you see with the naked eye, binoculars, or a telescope. Just set your coordinates and go.

Activities

Angular Size and Similar Triangles and Last Total Eclipse Ever! from NASA Education’s SpaceMath program explores angular measurement through learning about parallax and how astronomers use this geometric effect to determine the distance to Venus during a Transit of Venus.

Build a Sun Track Model.  Stanford University and NASA team up in this activity using paper plates and pipe cleaners to build a model of the sun’s year-long journey across Earth as the season’s change.

Measuring Shadows and Determining Sizes of Angles. NASA Education’s outdoor activity has students use yardsticks and rocks on string to measure the angle of the sun at 10 minute intervals, then calculate tangents and infer topography, as space scientists might do to study Mars. [YouTube 4:05]

Sunstruck! An Integrated Solar Education Experience NASA teamed up with the Michigan Science Center on this program primarily for middle school students and the general public on the sun and its effect on Earth and the solar system. Includes an interactive heliostat exhibit, Dassault Systemes Planetarium program.

Total Solar Eclipse! NASA Education’s comprehensive guide to the August 21, 2017 solar eclipse that will cross the United States. Take photos, measure the temperature at totality in your back yard, and other citizen science projects along with how to safely view this rare phenomenon.

Your World is Tilted LearnNC, a project of the University of North Carolina, Chapel Hill’s School of Education, created this visual/demonstration of why days are longer in summer and shorter in winter in the Northern Hemisphere, the opposite in the Southern Hemisphere.

Videos

Earth Sun Geometry. Creighton University associate professor of atmospheric science John M. Schrage’s video presentation for his 2012 course on computing the sun’s angles and other calculations. [YouTube 16:09] See also Schrage’s Computing Sun Angles [YouTube 16:29].

Measuring Shadows and Determining Sizes of Angles. NASA Education’s outdoor activity has students use yardsticks and rocks on string to measure the angle of the sun at 10 minute intervals, then calculate tangents and infer topography, as space scientists might do to study Mars. [YouTube 4:05]

Mechanism of the Seasons

Physical Science 9.2a -The Earth Moon Sun and Physical Science 9.2b -Rotation and Revolution

Spaceship Earth – An animated documentary of how Earth works.

Other

NOVA: The Search for Longitude James I. Sammons, a teacher at Jamestown School in Rhode Island, contributed this lesson on the history of developing a way to calculate longitude for PBS Education.

Acknowledgements

This lesson on solar geometry is possible due to the generous donations of Penn State lighting collaborative ProjectCANDLE and the National Science Foundation-funded STEM initiative, CarbonEARTH.

  • Project CANDLE is a partnership to Create an Alliance to Nurture Design in Lighting Education. It is a collaboration between Pennsylvania State University, the International Association of Lighting Designers (IALD) Education Trust, and lighting industry partners.
  • CarbonEARTH (Educators And Researchers Together for Humanity) fellowship program is part of a 5-year National Science Foundation (NSF) GK-12 grant that pairs teams of Penn State science, technology, engineering, and mathematics (STEM) graduate students with elementary and middle school science teachers from Pennsylvania’s Philipsburg and Harrisburg school districts.

Meet Lighting Engineer Tony Esposito

Lighting engineer Dr. Tony Esposito, author of this month’s featured lesson, created “Solar Geometry” while earning a Ph.D. in architectural engineering at Pennsylvania State University. The August 21 total eclipse offered a great opportunity to share his module with eGFI teachers and readers. We caught up with Tony, who studied color preference and color discrimination as a research assistant at Penn State, to learn more about his background and what sparked his interest in engineering and education:

Where did you grow up and what drew you to engineering and education?

I grew up in Northeast Philadelphia in a low-income, single-parent household, and am the first person in my immediate family to attend college. Throughout my life, I have enjoyed mathematics and science, and have vivid memories of sketching on the blueprints my uncle would mail to me. I think engineering picked me.

What did you study? Did you face many challenges?

I studied Architectural Engineering at Penn State. The biggest challenge, especially at first, was maintaining passable grades to enter, and stay in, the major. My education did not prepare me for college-level classes, and I worked many days and nights to catch up. Over time, I grew to love Architectural Engineering, and especially lighting design, which eventually became my specialization. Studying at Penn State, I learned the importance of the quality of the indoor environment, and how good, conscientious design can transform our experience and enhance our well-being.

[Click HERE to see his 2012 bio and master’s thesis project – the design of a New York City school.]

How did you came to create the solar geometry lesson? Any tips for teachers?

I created the Solar Geometry lesson during my graduate studies at Penn State. This lesson was sponsored by ProjectCANDLE, which is a partnership between Penn State and lighting industry partners to Create an Alliance to Nurture Design in Lighting Education. Its goal is to bridge the widening gap between the number of qualified lighting graduates and increasing demand from industry by creating a direct link between lighting students and professionals so that students emerge with the right skills, abilities, and attitudes for careers in lighting.

My biggest challenge was to distill a complex topic into manageable pieces. I wanted the lesson to be flexible; teachers can use one, two, or all parts of the lesson. They also can scale the technical difficulty of the lesson up or down to match their grade level, and use only the activities or presentation materials. I hope teachers across many grades and specializations will find this lesson useful.

Solar geometry is complex, but rhythmic and predictable. If teachers are initially unfamiliar with the concepts, they should focus on learning the standard conventions, and solar geometry will become second nature over time. When in doubt, use physical models to show the geometry between the sun and the earth; it is how I reorient myself when I get lost! Also, make sure to use the presentation notes for additional resources!


What are your future plans?

Several months ago, I graduated from Penn State with a Ph.D. in Architectural Engineering. Since then, I have moved on to continue my research at Philips Lighting Research NA in Boston, Mass. I study lighting quality and color rendering of light sources.

How do you spend your free time?

I spend most of my free time traveling, reading, and practicing calligraphy. I enjoy traveling to new cities, reading about psychology, and practicing my handwriting. I am currently learning the italic alphabet with a flat parallel pen and will soon move on to Engrossers script with an oblique pen holder!

posted 8/3/17