eGFI - Dream Up the Future Sign-up for The Newsletter  For Teachers Online Store Contact us Search
Read the Magazine
What's New?
Explore eGFI
Engineer your Path About eGFI
Autodesk - Change Your World
Overview E-tube Trailblazers Student Blog
  • Tag Cloud

  • What’s New?

  • Pages

  • RSS RSS

  • RSS Comments

  • Archives

  • Meta

Lend A Hand: Teaching Forces


Lesson courtesy of TeachEngineering. 

Summary

Working in groups of three, students learn about types of forces, the relationship between form and function, and the structure of the hand by working as biomedical engineers to design, build, and test their own hand “gripper” prototypes that can grasp and lift a 200 ml cup of sand.

Grade Level: 6 to 8

Time: 270 minutes (six 45-minute classes)

Learning objectives
After this activity, students should be able to:

  • Explain how the engineering design process steps are conducted during each class.
  • Generate questions for client/user to focus on a problem statement.
  • Describe the interaction of forces acting on the prototype during testing periods.
  • Apply the engineering design process in creating prototype devices to aid children in holding a cup of sand, and test them for strength.

Academic Standards

Next Generation Science Standards

  • Plan an investigation to provide evidence that the change in an object’s motion depends on the sum of the forces on the object and the mass of the object. [MS-PS2-2]

Common Core State Mathematics Standards

  • Fluently add, subtract, multiply, and divide multi-digit decimals using the standard algorithm for each operation. [6.NS.3]

International Technology and Engineering Educators Association

  • New products and systems can be developed to solve problems or to help do things that could not be done without the help of technology.

Engineering Connection 
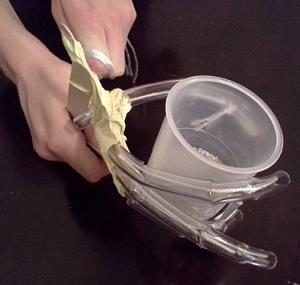
Biomedical engineers use their knowledge of biology, physics, math, and technology to create biomechanical devices. Biomedical engineers create assistive hand devices by researching the anatomy, form, and function of the hand and the necessary responses and movement required for performing basic and advanced functions, such as rotating the hand vs. gripping an object. In considering the qualities of the materials that can be used for the specified functions, students subsequently practice the skill of designing and testing prototypes within constraints—all essential aspects of engineering.

Click HERE for vocabulary and definitions.

Photos of student-designed hand prosthetics © 2015 by Kelly Cox, science teacher, Holy Name Central Catholic Jr. High School, Worcester, Mass.

Materials

For the teacher’s introductory presentation:

Each group needs:

For the entire class to share:

  • ~100 feet clear vinyl tubing (preferably ½” outer diameter, 3/8″ inner diameter)
  • 1 box regular-size craft sticks
  • 1 box jumbo-size craft sticks
  • 1 roll duct tape
  • 1 roll masking tape
  • 10-lb. bag play sand
  • ~1,000 feet polyester string
  • 4-10 electronic scales or triple beam balances
  • 4-10 force meters or spring scales
  • 4-10 100-ml graduated cylinders
  • 4-5 6-8 oz. clear plastic cups
  • (optional) 4-5 tube cutters
  • (optional) dynamometer
  • computer and projector, to show the class the PowerPoint® presentation

Introduction/Motivation

If a person has trouble seeing, what is used to help them see? (Glasses) If a person has trouble hearing, what is used to help them hear? (Hearing aid) If a person has trouble walking, what is used to help them walk? (Cane or crutch) A pair of glasses, a hearing aid, a cane or a crutch—what do these objects have in common? They are all assistive devices, a product that helps someone perform a function that could not be done without that piece of technology.

Technologies like these are developed by biomedical engineers who integrate their STEM (science, technology, engineering and mathematics) knowledge, including the field of medicine, to create products and processes that improve the health and quality of human lives.

In this project, you play the role of biomedical engineers to design and test an assistive hand device that helps someone with cerebral palsy grip a cup that varies in weight.

Procedure

Background

Students should have read the Fairly Fundamental Facts About Forces and Structures lesson, which provides all necessary background information for this activity.

Before the Activity

With the Students

Day 1 – Introduce the EDP and Assistive Hand Device Challenge

  1. (slides 2-12) Instruct students to record notes from the presentation. These slides includes key vocabulary terms, the steps of the design process, and the criteria and constraints for the design challenge.
  2. Give students the Problem Statement Worksheet and, from the client statement, have students individually compose brief problem statements of essential information. Lead a class discussion to make sure all significant information has been identified.
  3. Hand out the List the Client’s Criteria Worksheet, and have students identify the prototype requirements. Lead a class discussion to make sure all significant information has been identified.

Day 2 – Conducting Research

  1. (slides 13-19) Instruct students to record notes, including key vocabulary terms, the purpose of reverse engineering, and the expected structure of T-chart. (On the classroom board, demonstrate to students the intended structure and purpose of a T-chart. This information is not provided in the presentation.)
  2. Provide students with the Materials Cost Table & Budget Sheet so they are aware of the materials they are permitted to use in constructing the prototypes.
  3. Assign each student five vocabulary terms for which to record definitions and other relevant information. They submit this information to the teacher, who compiles it for sharing in a class discussion.
  4. Have students research the structure of the human hand as well as assistive hand device technologies. Direct students to make T-charts of the pros and cons of these technologies in consideration of the specified criteria and constraints. Require students’ charts to include information about the structures and functions of existing designs. Students submit their information to the teacher for later use during a class discussion.

Day 3 – Budgeting, Brainstorming and Building

  1. (slides 20-22) Instruct students to record notes, including the key vocabulary term “budget” (slide 20) and the definition and guidelines for brainstorming (slides 21-22). Explain the requirements for purchasing materials—that students must fill out the materials for purchase on their budget sheets, so the teacher can sign off on the budget calculations before handing out materials.
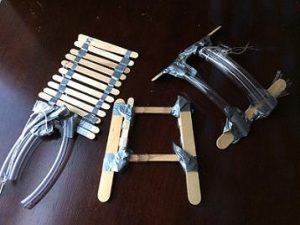
  2. Assign students to groups of 3-4 students each. Direct the groups to brainstorm among themselves hand device designs (refer to Figures 1-3 for examples created by other student groups).
  3. Once teams have an idea of viable designs, they create at least three sketches, labeling the parts and materials to be used for each structure in the design.
  4. Groups who complete the minimum three sketches must reach agreement between all members to begin with one of the three sketches. These groups fill out their budget sheet and begin building.

Day 4 – Prototype Construction

  1. If groups did not start building by now, then it is time to select one sketch to start building the prototype today.
  2. Have groups fill out their materials budget sheet, obtain materials and construct prototypes.
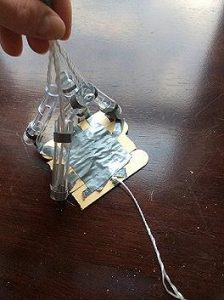
The fingers (clear plastic tubing) of a student’s prototype are pulled by threaded strings.

Day 5 – Prototype Building, Testing, Communication and Redesign

  1. Have students record notes from (slides 23-28) the presentation, which includes key vocabulary and the EDP steps 4-8.
  2. Give each group 1 cup filled with 200 ml sand, and a second, empty cup. Each group tests its prototype by gripping the empty cup. Once they have succeeded in lifting the empty cup, they slowly pour the sand from the filled cup into the empty cup. Explain to students that this test is not exactly the same between groups, since the rate of sand being poured per second will differ between groups.
  3. Instruct students to communicate within their groups as to how the prototype performed, using key vocabulary terms (physics-based). Then students create new sketches that incorporate improvements to their design prototypes.
  4. Groups continue to build second prototypes, completing their budget sheets and obtaining materials as needed.
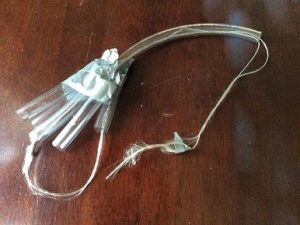
student's prototype of prosthetic hand

A student’s hand device prototype, designed to pull a string to tighten the grip around a cup.

Day 6 – Reflection

  1. Give each student the Reflecting on the Engineering Design Process Worksheet. Describe what is expected in filling out each part of this assignment.
  2. Give teams time to make final alterations to their prototypes. Walk around to each group and have them perform a final test. Have students to discuss within their groups how their prototype performed, discussing forces and using other key vocabulary terms.
  3. In groups, have students complete the rest of the EDP worksheet.

Assessment

Click HERE for pre-, embedded, and post-activity assessment.

Safety Issues

Instruct students on how to use safely use the tube cutters (or scissors). Observe students while cutting tubes.

Troubleshooting Tips

As students conduct the iterative process of building, testing, and redesigning, advise them to consider reusing as many materials as possible. Remind students that they do not get a budget increase for each prototype; they must make do with the overall designated budget.

Activity Extensions

  • Have students apply their knowledge of forces to draw free body diagrams of their prototypes’ performances in the final test.
  • Have students explore marketing by assigning criteria for visual appeal. Have students make 1-2 minute commercials. Follow this with a vote by instructors or students from another class.
  • Engineering and Empathy: Teaching the Engineering Design Process through Assistive Devices. Worcester Polytechnic Institute month-long lesson for middle school students focuses on three design projects—an off-road wheelchair, a portable wheelchair ramp, and an automatic floor sweeper computer program.

Activity Scaling

  • For lower grades, do not permit them to use the tube cutter.
  • For higher grades, require design teams to communicate in writing the strengths and weaknesses of their design sketches, before giving out materials. Provide loans with interest, for extra money in the budget.

Additional Resources

Lend a Hand. eGFI feature on several engineering programs where students design and build prosthetic hands for children or adapt toys for use by children with disabilities.

Prosthetic hands designed by Worcester, Mass., high school students. Boston 25 news article and video, April 26, 2017, about their project to make inexpensive mechanical hands for children overseas.

Design and Manufacture of a Scalable Prosthetic Hand Through the Utilization of Additive Manufacturing. Example-filled undergraduate thesis illustrating the steps by which four Worcester Polytechnic Institute students decided on the design and manufacture of prosthetic hands for various ages of users.


Contributors

Kelly Cox, Kristen Billiar, Terri Camesano, Jeanne Hubelbank; © 2015 by Regents of the University of Colorado; original © 2015 Worcester Polytechnic Institute

Supporting Program

Inquiry-Based Bioengineering Research and Design Experiences for Middle-School Teachers RET Program, Department of Biomedical Engineering, Worcester Polytechnic Institute.

This activity was developed under National Science Foundation grant no. EEC 1132628. However, these contents do not necessarily represent the policies of the National Science Foundation, and you should not assume endorsement by the federal government.

Online K-12 Engineering Certificate Program

Tufts Center for Engineering Education and Outreach summer students

Do you want to dive into K-12 engineering education in your pajamas?

Tufts University’s Center for Engineering Education and Outreach is now recruiting for its third cohort of teachers for its online Teacher Engineering Education Program. The 18-month, graduate-level program consists of four courses that cover engineering content and teaching practices designed to foster hands-on, problem-based learning. Courses are rigorous, delivered completely online, and asynchronous. Each is worth 4 graduate credit hours and can be taken individually or as a special certificate program

The program has tracks for those new to engineering education as well as experienced educators looking to advance their teaching practices.

Participants engage in open-ended design projects at their kitchen tables to build their engineering knowledge and interact with colleagues, looking at student work and building relationships that will last far beyond the program’s completion. Experience and novice teachers have been excited to participate in the program.  “If you are looking for a course that will fundamentally transform the way you teach, then the program could be for you,” says Silvia Scott,  a K-5 technology integration specialist from Connecticut. “I thought I knew about teaching technology, but this course will give you access to a supportive teaching team, discussions on ground breaking research with your TEEP cohort, and hands-on labs to develop your engineering skills and knowledge.”

To learn more,

  1. Visit http://teep.tufts.edu or e-mail teep@tufts.edu
  2. Register to attend a VIRTUAL OPEN HOUSE:

•June 14, 2017 at 4 PM EDT
•June 22, 2017 at 4 PM EDT

3.  Talk to a Tufts Center for Engineering Education & Outreach representative at the:

Prepare your students to change the world while meeting the required standards of a quality education!

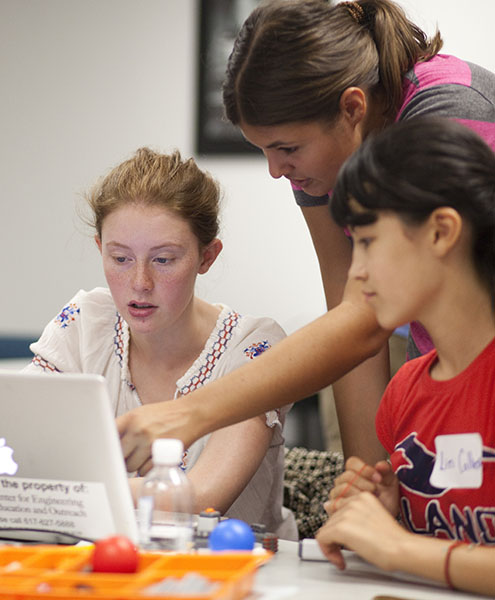
Photo by Kelvin Ma/Tufts University: Summer campers construct a robotic arm out of LEGOs as part of a presentation from NASA astronaut Mike Foreman at Tufts University’s Center for Engineering Education and Outreach, Aug. 13, 2012.

NOAA’s Planet Arcade


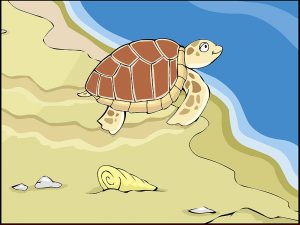
Classify clouds, draw a nautical chart, or learn about sea turtles and their quest to nest. These are just some of the online games highlighting environmental science and stewardship on the National Oceanic and Atmospheric Administration’s Planet Arcade portal.

Several games were developed by students. Emily Yan, a student at Richard Montgomery high school in Maryland, worked with NOAA’s Ocean Service Education team to develop a game about the animals of the Chesapeake Bay as part of her school’s community service program. Jing Wang, a student in the Montgomery College Computer Games and Simulations program, provided programming support on the development of Chesapeake Bay mini games. And a gaming team partnership between NOAA and Montgomery College resulted in a serious learning game called Waterlife: Where Rivers Meet the Sea.

The weather agency also offers a number of short videos about oceans, visualizations, and simulations, such as the tsunami depicted above.


Who Moved the Beach?


Activity adapted from the National Oceanic and Atmospheric Administration’s coastal management lesson plans. Click HERE for PDF and HERE for html. (Note: Many links cited in original lesson are broken; the following activity restores some and replaces others.) 

Summary

High school students working in groups of three to four learn about the primary causes and impacts of coastal erosion, and use elevation data to construct profiles of three beaches, make inferences about the erosion process, and discuss how humans should respond.

Grade Level: 8 to 12

Time: 45 minutes (one class period), plus time for student research

Learning Objectives

After doing this activity, students should be able to:

  • Identify coastal erosion as a natural process and explain how human activity can increase the risks associated with coastal erosion.
  • Identify options for reducing risks caused by coastal erosion and the advantages and problems associated with each.
  • Analyze and interpret beach elevation data and make inferences from these data about the relative vulnerability of different beaches to coastal erosion.

Learning Standards

National Science Education Standards

Content Standard A: Science as Inquiry

  • Abilities necessary to do scientific inquiry; Understandings about scientific inquiry

Content Standard B: Physical Science

  • Motions and forces; Interactions of energy and matter

Content Standard D: Earth and Space Science

  • Energy in the earth system; Geochemical cycles

Content Standard E: Science and Technology

  • Abilities of technological design

Content Standard F: Science in Personal and Social Perspectives

  • Natural resources; Environmental quality; Natural and human-induced hazards; Science and technology

Next Generation Science Standards

Earth Systems

  • Make observations and/or measurements to provide evidence of the effects of weathering or the effects of erosion by water. (Elementary)
  • Collect data to provide evidence for how the motions and complex interactions of air masses results in changes in weather conditions. (Middle)

K-12 Ocean Literacy framework, scope and sequence guide

Engineering Motivation/Background

Almost half of the people in the United States live near the coast. As the coastal population continues to grow, more people and property will be exposed to hazards caused by severe storms, floods, shoreline erosion, and other natural hazards. Homes and businesses are often built in low-lying areas and barrier islands that are particularly vulnerable to storm damage. The potentially disastrous consequences of this trend became obvious during the summer of 2004, when residents of Florida were battered by four major hurricanes within six weeks, resulting in billions of dollars worth of damage. Much of the price is eventually borne by American taxpayers through federal government funds for disaster relief and reconstruction.

While erosion and land subsidence (land sinking below sea level) are less spectacular than strong storms, they are just as important in economic terms. Erosion alone is estimated to cause billions of dollars of damage every year along U.S. coasts. Subsidence around New Orleans has necessitated large expenditures for pumping and dike maintenance. Subsidence in Texas, Florida, and California threatens high-value land uses and causes damages that cost millions to repair. Attempts to protect against coastal hazards can cause additional problems. Sea walls intended to protect against storm waves can actually accelerate beach erosion and reduce the capacity of beaches to absorb storm energy. As a result, buildings adjacent to the beaches are exposed to the full force of wind and waves. Human activities such as diking and drainage of land around New Orleans, ground water removal in Texas and Florida, and extraction of oil and gas in California have accelerated subsidence in these areas. (See, for example, the U.S. Geological Service’s page on subsidence.)

Experience has shown that prevention is the best approach to deal with these problems. It costs much less to prevent construction in areas unsuitable for development than to provide funds for emergency response, cleanup, and reconstruction. NOAA’s Office of Ocean and Coastal Resource Management works in partnership with state governments to minimize the impact of coastal hazards by:

  • Identifying areas that are most likely to be severely affected by these hazards;
  • Developing warning systems and response plans to minimize human exposure to hazardous events;
  • Establishing appropriate building codes; and
  • Restoring the natural protective functions of beaches and dunes.

See NOAA’s Digital Coast site for more information. For data sets, see NOAA’s Digital Coast Data Sets and Shoreline Data Explorer.

From 1996 to 2000, the National Ocean Service, NASA, and the U.S. Geological Survey partnered in an Airborne LIDAR Assessment of Coastal Erosion (known as the ALACE project). LIDAR stands for light detecting and ranging, and is part of NASA’s Airborne Topographic Mapper (ATM). The ATM system uses a laser altimeter installed in an aircraft. As the aircraft flies along the coast, the altimeter scans the earth’s surface in a path several hundred meters wide, and acquires an estimate of ground elevation every few square meters. The ALACE project collected topographic data (elevations of dunes and beaches) along U.S. coasts. These data have been used to create maps that show the relative vulnerability to coastal erosion. These maps can be used to quickly locate areas that may be severely impacted by coastal storms, to help plans for emergency response as well as environmentally appropriate development.

Maine Geological Survey’s report, Using LIDAR to Monitor Beach Changes, provides a clear explanation, with images and graphs, of how this technology was used from 2004 to 2006 to map changes in the state’s shoreline.

Also see NOAA’s Coastal Topgraphic Lidar data sets, LIDAR 101 (includes data sets), and introduction to LIDAR.

Materials

  • Computers with Internet access
  • Copies of “Coastal Erosion Subject Review Worksheet,” (pages 10 – 12 of PDF or click HERE for html and HERE for word doc with updated links); one copy for each student or student group (Note: some websites no longer exist.)
  • Graph paper or computers with spreadsheet and graphing software

Procedure

Note: If you want to introduce this lesson by showing images of severe coastal erosion, such as that caused by hurricanes, visit the NOAA photo library at http://www.photolib.noaa.gov/

1. Tell students that their assignment is to learn about coastal erosion processes by completing the “Coastal Erosion Subject Review Worksheet.” [docx] If students do not have access to the Internet, download copies of materials cited at the beginning of the worksheet and make one copy of each article available to each student or student group.

2. Review answers for the worksheet. [See pages 4-6 of PDF for correct answers.]

3. Review the idea of the ALACE project and LIDAR mapping, which students may have encountered while researching answers for the worksheet. Ask students what sorts of beach profiles might be most resistant to wave erosion.

Either follow the BRIDGES data exercise, using measurements for Ocean City, Md., to plot the change in the beach’s elevation and profile over time on graph paper or a spreadsheet. Click HERE for a beach profile graphing exercise using this beach.

Or use beach profile data from a source such as:

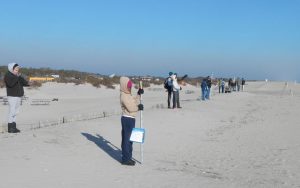
Live near a beach? Take your own coastal profile measurements, like this group of students measuring the shoreline at Cape Hatteras National Park. See the University of Maine’s helpful how-to guide for volunteer beach monitors, or Analyzing the Dynamics of a Beach, an activity from the University of Florida.

Click HERE for Texas A&M’s primer on beach profile surveys and interpreting trend-data graphs.

4. Lead a discussion of students’ beach profiles. Ask students to infer which beaches might be the most vulnerable to wave erosion. Do the beaches have conspicuous dunes, for example? Ask what might account for the differences in the profiles for the same stretch of Ocean City, Md., beach. Students should recognize that a beach may have been exposed to winter storms that increase erosion and move sand offshore, but that by fall this sand could have been returned by the gentler waves typical of summer months. Be sure students realize that the offshore areas that receive eroded sand are obviously involved in these processes, and in fact are part of the total beach profile.

Discuss the three options for responding to erosion threats listed in the last question on the worksheet. Students should realize that while leaving may be the least expensive option, this is often impractical where development has already taken place. Renourishment, however, is seldom a permanent solution. (See Assessing the Environmental Impacts of Beach Nourishment by University of North Carolina, Chapel Hill, researchers, or NOAA’s 2000 report on state beach nourishment programs.) Similarly, various construction options can make property more resistant to erosion, but structures such as sea walls, jetties, and bulkheads often increase erosion. (See armoring example at Wells Beach, Maine.)

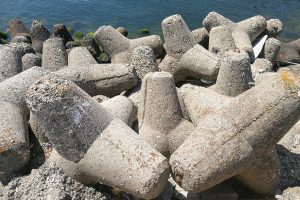
Closeup of concrete tetrapod to prevent coastal erosion and provide barrier protection against strong waves

Reports and articles needed to complete worksheet:

Evaluation of Erosion Hazards,” (Summary) April 2000 report prepared for the Federal Emergency Management Agency by the H. John Heinz III Center for Science, Economics, and the Environment. Read full report.

NOAA’s Coastal Hazards Assessment.

National Assessment of Storm-induced Coastal Change Hazards.

Beaches on the Brink. 2000 CNN report.

Activity Extensions

Build and use a stream table to simulate erosion and other processes involving sediment transport by water. (Source: Missouri Stream Team Information)

Resources

Research Reports 

Protecting the Health and Well-being of Communities in a Changing Climate Proceedings of a 2017 National Science Foundation workshop (brief report).

For Educators: Labs, Lessons & Other Hands-on Coastal Geography and Environmental Engineering Science sites

The BRIDGE,” an ocean of free, teacher approved marine science education resources” from the College of William and Mary’s Virginia Institute of Marine Science, includes a “immerging properties” seal level investigation using data, “where’s the beach” Data activity that uses data to analyze erosion and a coastal geology lab from Oregon State University.

Live near a beach? Take your own beach profile measurements. (See the University of Maine’s helpful how-to guide for volunteer beach monitors.) Or use the University of Hawaii’s sea-level data to compare how beaches are shifting in different U.S. coastal regions.

Graphing the Beach Profile. How-to guide from the education program of the New Jersey Sea Grant Consortium includes how to count bird and human tracks.

Websites:

Coastal Erosion. National Oceanographic and Atmospheric Administration’s “climate resilience toolkit” includes effective strategies for dealing with coastal erosion and case studies.

Coastal Erosion Control Design. NewYork State’s Department of Environmental Conservation site.

Coastal Hazards.  NOAA’s website include podcasts, interactive sea-rise viewer, facts about coastal vulnerabilities, and infographic about coastal resilience.

Coastal Management. NOAA’s Office for Coastal Management includes state-by-state information on topics from coastal zone management to coral restoration, and fast facts on ocean debris, ports, and economics.

College of William & Mary’s Virginia Institute for Marine Science includes GIS data, decision trees for defending coastlines,  and a K-12 education site.

Dune Grass Planting. NOAA video and article on effort to stabilize the beach at the Oceana Naval Air Station by planting panic grass.

Protecting our Coastline. Blog post primer on sea walls, jetties, groins, beach fences, and other methods of protecting shorelines by a Massachusetts civil engineer.

Shells and Students. U.S. Fish and Wildlife Service article on Project PORTS – Promoting Oyster Restoration through Schools – and building living reefs off of coastal New Jersey using bags filled with oyster shells.

Shoreline Engineering. Primer on “stabilizing the unstable” with jetties, groins, and other engineered solution.

Taking the Pulse of a Beach. Maine Geological Survey’s July 2013 uses the U.S. Geological Service’s Digital Shoreline Analysis System to calculate the shoreline’s changes over time.

U.S. Climate Resilience Toolkit. NOAA’s site includes case studies, such as restoring dunes in New Jersey after Hurricane Sandy to protect the shoreline, a guide to risk assessment, and ideas for taking action.

Dune Migration and Shoreline Protection from Climate.gov on Vimeo.

What causes beach erosion? Scientific American answers a reader’s question about East Coast beach erosion.

Videos:

Another Day of Fighting Beach Erosion on Australia’s Gold Coast. Popular seaside resort spends $20,000 a day on sandbags and other emergency measures to protect property. [YouTube 2:19]

Beach Erosion. Time-lapse video from Florida Institute of Technology’s wave tank showing the effects of waves and wind on sand. [YouTube 1:41]

Drone video of eroding seaside cliffs threatening Pacifica, Calif. [YouTube 6:02]

Erosion at the Beach. FunScienceDemos uses tub of sand and water to simulate erosion. [YouTube 3:32]

House on Cliff’s Edge Falling into Ocean! 2010 CNN report on Pacifica, Calif., home teetering on edge of rapidly eroding cliff. [YouTube 1:38] And the view in 2016.

King Tide Swamps La Jolla (Calif.) Aerial video of Nov. 26, 2015 tide that inundated La Jolla, California. [YouTube 1:12]

Methods Used to Slow Down Coastal Erosion. Short 2011 tutorial on engineered and sustainable ways currently used to ease coastal erosion. [YouTube 1:41]

What if your home was slipping into the ocean? National Geographic documentary about a community on North Carolina’s Outer Banks that is fighting erosion. [YouTube 4:49]

What is coastal Erosion? British Environment Agency explains the four major types of erosion. [YouTube 4:11]

Activity posted May 2017.

Gimme Shell-ter

Like many areas along the New Jersey shore, Gandy’s Beach in the upper Delaware Bay was devastated by Hurricane Sandy in 2012.

The solution? Engage school communities in a real-world restoration project: Building a living reef from bags of discarded oyster shells to protect both oyster beds and shoreline from future storm damage.

The effort, a partnership between Project PORTS (Promoting Oyster Restoration Through Schools), the U.S. Fish and Wildlife Service, and the Nature Conservency, is described in this 2015 blog post by Margie Brenner of the the USFWS’s Northeast office and this 2016 follow-up post by Hope Kelley in 2016.

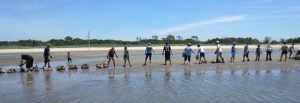
Project PORTS is an education and community-based oyster restoration program run out of Rutgers University’s Haskin Shellfish Research Laboratory. Since 2007, it has worked with student volunteers to construct a living oyster reef of more than 5 acres about a mile offshore.  In 2013, the U.S. Fish and Wildlife Service was awarded nearly $900,000 from Hurricane Sandy resilience funds for a Gandy’s Beach shoreline protection project to improve the ability of the beach to withstand future storm surges and coastal erosion while helping to stabilize the decreasing oyster population.  The work included a partnership with Project PORTS and the Nature Conservancy to involve local students in filling 15,000 bags with oyster shells. Hundreds of volunteers then placed  the bags in the water just off Gandy’s Beach in the oyster reef breakwater project.

As of 2015, when the effort began, the reef was providing a habitat for more than 20 million oysters, according to Jenny Paterno, the project leader for Project PORTS. The oyster reef structure, she explained, “will serve to slow down wave energy and reduce erosional forces while providing enhanced habitat for oysters, ribbed mussels, and a suite of other species.”

Gandy’s Beach has lost an estimated 500 feet of shoreline since 1930, and local communities experienced increased flooding during high tide events and major storms due to the reduction of surrounding salt marsh and beach buffers.

Katie Conrad, a fish and wildlife biologist at the Service’s New Jersey Field Office and project leader, said the work will construct nearshore oyster reef breakwaters along high energy shoreline, coir biolog living shoreline (logs of coconut fiber wrapped in mesh) on low energy sites, and hybrid living shoreline that uses both techniques in one location. “This will help stabilize approximately 3,000 feet of beach and tidal marsh shoreline, and ongoing monitoring will measure how well the oysters recruit on the different structures, so future restoration projects can benefit from what we have learned,” says Conrad.

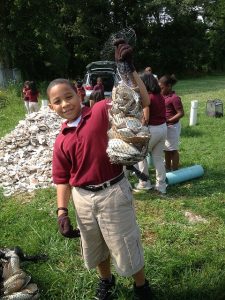
A student at West Avenue School  in Bridgeton, N.J. proudly shows off a shell bag built for the Gandy’s Beach oyster reef. Credit: Project PORTS staff

The materials used to create the shell bags are locally-sourced and New Jersey native. Project partner the Nature Conservancy collects clam and oyster shells from restaurants during scheduled weekly pickups in Atlantic City, and also receives donated surf clam shells from a local processing plant in Millville, New Jersey. The mollusk shells are then “cured” and distributed to schools where students construct the bags. Project PORTS works with over ten schools per year, primarily local students from Cumberland County, New Jersey.
The benefits of these living shorelines are three-fold: they help prevent erosion for wildlife and public recreational use; buffer coastal communities against impacts of future storms; and provide habitat for underwater species in the face of climate change and sea-level rise.

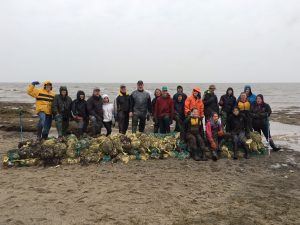
8th grade students of East Windsor Middle School in Broad Brook, Connecticut, along with their parents and siblings, visited Cape May, New Jersey, to participate in Project PORTS. 

eGFI Survey Results: We Hear Ya!

Thanks to all who completed our recent ASEE eGFI Teachers’ survey – including  South Carolina elementary instructional coach Pamela Smith, winner of the $250 gift-card drawing!

Here’s what we learned:

  • Diverse. You come from all 50 states, the District of Columbia, and several countries; teach preschool through high school; and hold administrative positions ranging from principal to district superintendent to STEM coordinator.
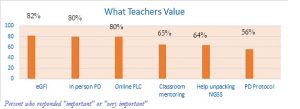
  • Top likes. You placed the highest value on eGFI Teachers and other useful, free resources. (Some 82 percent rated it as very important or important.) You also value in-person vs. online professional development – though administrators preferred webinars – and online professional learning communities. There also was great interest in a professional-development protocol* to gauge if what was being delivered was authentic engineering and design.
  • Top challenges. Lack of money, including funds to pay for materials and professional development, and a support system topped your list. Many respondents also felt somewhat or very unprepared to incorporate engineering into their classes.**

Your input will help ASEE and eGFI improve our offerings – and help educators in every grade inspire their students with engineering!

ASEE has your covered!
*Click HERE for professional development standards and matrix for teachers of K-12 engineering developed by ASEE’s Pre-College Division.
**Click HERE to attend ASEE’s annual PreK-12 Workshop, an immersive day of authentic, hands-on activities and networking opportunities designed to help you put the E in STEM. Saturday, June 24, 2017 in Columbus, Ohio.

Summer Experiences & PD for Teachers


Iowas State University’s NSF EPSCoR middle school STEM teachers institute

Summer 2017 workshops, research experiences, and other professional learning opportunities for STEM teachers.

Search engines

Research Experiences for STEM Teachers. The Institute for Broadening Participation’s Pathways to Science hosts a searchable database of more than 1,500 STEM programs, including research opportunities and pathways to engineering for K-12 educators, paid summer internships and summer programs for K-12, undergraduate, and graduate students, and more.

Workshops and Other Professional Learning Programs

American Society for Engineering Education. ASEE’s annual PreK-12 Engineering Education Workshop is a full day of hands-on activities, panel discussions, and networking opportunities designed to help classroom teachers incorporate authentic engineering education into their classrooms. Date: Saturday, June 24, 2017. Where: Columbus, Ohio, Convention Center. Register HERE ($35 for members; non-ASEE members should click on “create new account.)

New! Knowles Science Teaching Foundation is presenting two ASEE-endorsed week-long courses on integrating engineering design challenges into STEM classes. Engineering Lever courses come with a year of follow-up coaching and professional learning community. June 26-30 in Wisconsin, and July 22-26, 2017 in Philadelphia. REGISTER by June 152017.  Learn more.

New! ASEE and Texas A&M are teaming up for an immersive, five-day residential workshop on incorporating engineering into your STEM classes using flying devices from June 19-23, 2017. REGISTER by May 31. Learn more.

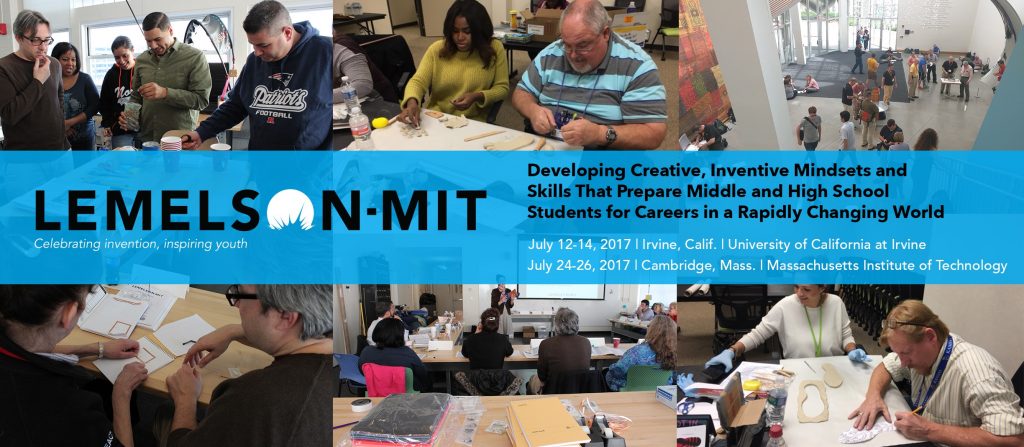
NEW! Lemelson-MIT Program, located within the School of Engineering at the Massachusetts Institute of Technology (MIT), is hosting two professional development workshops for middle and high school educators at the University of California, Irvine from July 12-14 and the Massachusetts Institute of Technology from July 24-26. The three-day workshops will develop educators’ capacity to help kids learn to think and act as an inventor while developing a solution to a real-world problem including strategies for the effective use of MIT’s JV InvenTeam activity guides.

Exploratorium. Three weeks of working with scientists and educators at the San Francisco-based Exploratorium’s Summer Institute for Teachers Stipend: $2,500. Dates: June 19-July 7, 2017. Apply by March 15, 2017.

IgnitEducation Teacher Fellowships. Eight-week program pairs full-time teachers in California’s Alameda, Contra Costa, Marin, San Francisco, San Mateo, Santa Clara, Santa Cruz or Solano counties with industry or university mentors to conduct real research. Applications are due in March 31

National Science Foundation EPSCoR for teachers. NSF’s Experimental Program to Stimulate Competitive Research program includes teacher professional development workshops and teacher-student research opportunities, such a Vermont’s water-quality summer research project for high school teachers and students. Check your state for details. Deadlines vary.

NSF’s Research Experience for Teachers (RET). Six to eight-week programs for teachers to conduct research with university or industry engineers and scientists. Browse programs HERE. Dates vary.

National Institute of Standards and Technology. Two-week summer institute for middle school teachers includes $2,000 stipend plus up to $2,000 to cover travel and lodging to NIST’s Gaithersburg, MD., campus. Dates: July 10-21, 2017.
Apply by March 3, 2017.

Six-week summer research experience for middle school teachers to work with NIST scientists and engineers at the Gaithersburg, MD, campus. Stipend is $8,000. Teachers must be nominated by their school districts. Applications due March 3, 2017.

New York University’s Tandon School of Engineering. NSF-funded summer research experiences and institutes for middle and high school teachers in such fields as cybersecurity and robotics. Open house May 6, 2017. Applications due May 15, 2017.

STEM Think Tank & Conference. Growing sustained STEM is the theme for the 2017 STEM Think Tank & Conference, which brings together K-12 teachers, informal educators, and university outreach coordinators focused on girls in STEM. This year’s conference is at Harpeth Hall, an independent girls’ school in Nashville, Tenn. Dates: July 12-14, 2017. Early registration ends May 31, 2017.

U.S. Patent and Trademark Office. Summer Institute on Innovation, STEM, and Intellectual Property offers roughly 50 K-12 teachers hands-on activities and strategies for incorporating discovery and invention into instruction. Dates: July 2017. Email NSTI_Applications@uspto.gov for details.

University of Akron Research Experience for Teachers in Polymer Engineering. Eight week program for high school STEM teachers. Dates: June 13-August 3, 2017.

New! University of Washington K-12 Engineering Scholars. Six-week summer professional development program for 4th to 8th grade STEM teachers in Washington State includes annual stipend of $8,000 plus $2,000 for materials. Applications due March 10.

Lemelson-MIT JVInvenTeams & PD

The Lemelson-MIT Program, located within the School of Engineering at the Massachusetts Institute of Technology (MIT), has been celebrating outstanding inventors and inspiring young people to pursue creative lives and careers for more than 20 years.

A signature initiative is the Lemelson-MIT Junior Varsity (JV) InvenTeams™ – a curriculum and contest for students in grades 7-10 to hone hands-on skills and enrich their STEM education through invention-based design activities. There are eight JV InvenTeam activity guides now available free of charge in the resources section of the Lemelson-MIT website.

Invention kits of materials and tools that go along with the activities in each digital guide will soon be available online at a cost.

Lemelson-MIT will be hosting two professional development workshops for middle and high school educators this summer at the University of California, Irvine from July 12-14, 2017 and the Massachusetts Institute of Technology from July 24-26, 2017. The three-day workshops will develop educators’ capacity to help kids learn to think and act as an inventor while developing a solution to a real-world problem. The workshop includes strategies for the effective use of JV InvenTeam activity guides.

Register and learn more at lemelson.mit.edu/events. Contact Gayle Golding at ggolding@mit.edu for questions or by phone at 617-253-3410.


Lemelson-MIT Resources for Teaching Invention


The Lemelson-MIT Program, located within the School of Engineering at the Massachusetts Institute of Technology (MIT), has been celebrating outstanding inventors and inspiring young people to pursue creative lives and careers for more than twenty years.  Its Lemelson-MIT Junior Varsity (JV) InvenTeams™ are designed to help students in grades 7-10 hone their hands-on skills and enrich their STEM education through invention-based design activities.

Winners of the high school InvenTeams contest have been invited to the White House. See this Fox 5 broadcast with two 2014 winners from Massachusetts.

Eight JV InvenTeam activity guides are now available free of charge in the resources section of the Lemelson-MIT website. Invention kits of materials and tools that go along with the activities in each digital guide will soon be available online at a cost. Also check out the HowToons graphical guides to visual communicati0ns and how to sketch ideas and draw prototypes for patent applications.

Interested in encouraging your students’ inventiveness?

Lemelson-MIT will be hosting two professional development workshops for middle and high school educators this summer at the University of California, Irvine from July 12-14 and the Massachusetts Institute of Technology from July 24-26. The three-day workshops will develop educators’ capacity to help kids learn to think and act as an inventor while developing a solution to a real-world problem. The workshop includes strategies for the effective use of JV InvenTeam activity guides.

Register and learn more at lemelson.mit.edu/events. Contact Gayle Golding at ggolding@mit.edu for questions or by phone at 617-253-3410.