Visualize STEM
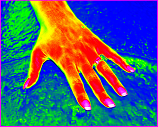
 In this lesson, high school students learn the value of writing and art in science and engineering by designing visual diagrams to communicate the results of thermal conductivity (heat flow) experiments they have conducted to anyone with little background on the subject. The principles of visual design include contrast, alignment, repetition, and proximity, and involve such elements as the use of lines, color, texture, shape, size, value, and space.
Filed under: Class Activities, Grades 9-12, Grades 9-12, Lesson Plans | Comments Off on Visualize STEM
Tags: Art, Class Activities, diagram, experiment, Grades 9-12, graphic design, heat flow, Presentations, STEAM, Technical Communications, thermal imaging, writing


