eGFI - Dream Up the Future Sign-up for The Newsletter  For Teachers Online Store Contact us Search
Read the Magazine
What's New?
Explore eGFI
Engineer your Path About eGFI
Autodesk - Change Your World
Overview E-tube Trailblazers Student Blog
  • Tag Cloud

  • What’s New?

  • Pages

  • RSS RSS

  • RSS Comments

  • Archives

  • Meta

Crowdsourcing Coastal Resilience
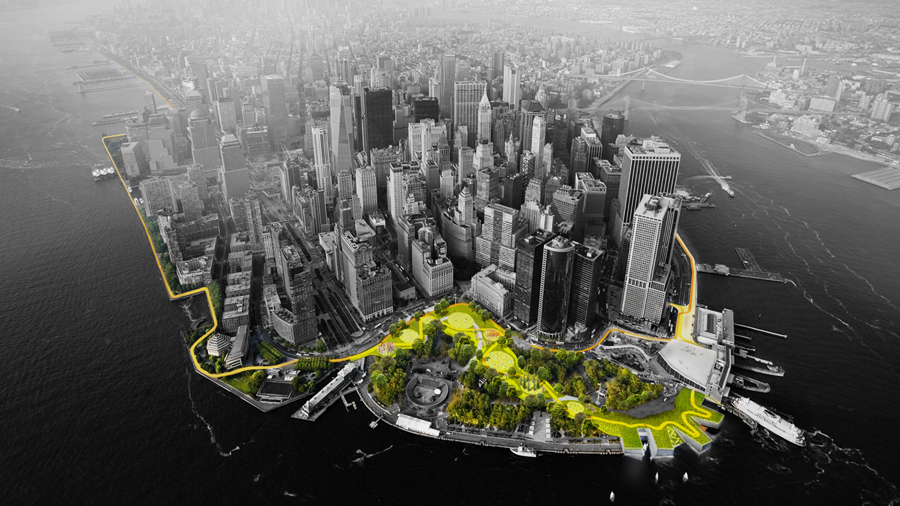
A Rebuild By Design competition winner includes a park along the lower tip of Manhattan with raised berms for flood protection that also serves as a park. Image courtesy Bjarke Ingels Group

Hurricane Sandy, whose 8-foot storm surges destroyed whole communities in New York and New Jersey in 2012, not only exposed widespread vulnerability to climate-related flooding. It also served as a wake-up call to engineers and governments about the need to re-imagine life along the coast. Simply replacing damaged sea walls made little sense, given the extent of the devastation – including 1117 dead and $71 billion in damage, including Manhattan’s venerable subway system.

Dutch designer Henk Ovink, an expert in flood-resilient buildings who was serving as an adviser to President Obama’s Hurricane Sandy Rebuilding Task Force, hit on a way to generate those innovative solutions: crowdsource the problem.

“It’s a paradigm shift from seeing water as a threat and just wanting to be protected to saying water is part of our life. Living with the water is a better perspective to moving forward,” he told the PBS Newshour.

In June 2013, the task force and U.S. Department of Housing and Urban Development launched the Rebuild by Design competition. From an initial 148 submissions from around the world, six projects – ranging from living reefs to a series of raised berms across lower Manhattan – were chosen to receive awards from $20 million to $335 million.

Today, Rebuild By Design has grown to include 100 “resilient cities” collaborating on research and design, policy and research efforts, and a Resilience By Design University initiative that includes New York University, the University of Pennsylvania School of Design, and Columbia University’s Graduate School of Architecture, Planning, and Preservation working to build an open-sourced interdisciplinary curriculum for a fundamentals course about design and resilience planning. The academics and design professionals were involved in the Hurricane Sandy Design Competition.

Click HERE (Columbia University) and HERE (PBS) for list of winners, write-ups, and links to videos.

Top prize: The Big U  $335 million.

BIG U: A Day in the Life from Rebuild by Design on Vimeo.

The Bjarke Ingels Group (BIG) proposed creating a vertical protection system of raised berms and bridges planted with salt-tolerant plants covering ten miles of coast across lower Manhattan. There are flood walls that can be raised in a disaster, but there are recreation spaces as well. A new Maritime Building would include a “Reverse Aquarium” on the water-facing ground floor to educate visitors about the marine life.

Resist, Delay, Store, Discharge – $230 million

Resist, Delay, Store, Discharge: A Comprehensive Strategy for Hoboken from Rebuild by Design on Vimeo.

OMA’s plan for Weehawken, Hoboken, and Jersey City looks at flood prevention and drainage for the towns. Two-thirds of Hoboken lies in a FEMA flood zone, and 94 percent of its surfaces are impermeable, trapping water. Building wetlands along the towns will delay incoming ocean-water, and filter outgoing storm water. Permeable paving, rain gardens, and bioswales allow surface water to drain, and a rainwater storage system will filter rainwater while serving as a public park.

Living Breakwaters – $60 million

UPDATE: Living Breakwaters from Rebuild by Design on Vimeo.

The Living Breakwaters project builds out Staten Island’s shoreline, building a marshland system along the shore supported on underwater berms. The berms, made of eco-friendly concrete, serve as a place for wildlife like clams and mussels to build their homes. Plans included a wetland education center for islanders, areas for kayak and recreational equipment storage, and support for the local fishing community.

Building wetlands lets the water out in the event of a flood, filtering it and cleaning the surrounding bay. By contrast, a wall would hold water on the island like a bathtub and further disconnect New Yorkers from their marine surroundings.

Save Our Shore!


Coastal engineering activity courtesy of the University of Hawai’i at Manoa series: Exploring Our Earth: Teaching Science as Inquiry. Video and additional resources curated by eGFI.

High school teachers might wish to use NOAA’s Who Moved the Beach coastal management lesson.

Summary

In this activity, students in grades 3 to 8 learn about coastal erosion and the role of engineers in protecting shorelines by applying the engineering design process to devise ways to mitigate erosion that take public concerns into account – and use both structures and policies.

Grade level: 3 – 8

Time: 50 – 120 minutes

Learning Objectives

After doing this activity students should be able to:

  • Understand the causes of beach erosion
  • Apply the engineering design process
  • Develop solutions that address public needs and concerns
  • Evaluate the strengths and weaknesses of different designs
  • Understand constraints as a crucial element in problem solving
  • Understand the role of policy in developing solutions

Standards

Next Generation Science Standards

Materials 

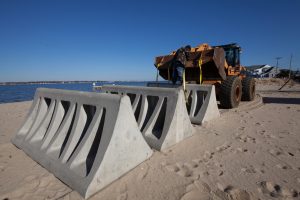
FEMA installs prism barriers at Ocean Gate, NJ, to prevent erosion after Hurricane Sandy in 2012.

  • Flat wave tank or large flat plastic bin
  • Water
  • Wind generating source (e.g., fan) or paddle or other object to displace water
  • Table with Examples of Anti-Erosion Structures [PDF HERE]
  • Sand
  • Toothpicks
  • Assortment of small rocks
  • Small building blocks or other waterproof objects to represent houses
  • Rosemary sprigs or other objects to represent vegetation
  • Ruler
  • Towels
  • Protractor (optional)
  • Metronome or other sound recording device (optional)
  • Camera (optional)
  • Computer program to analyze beach area on pictures (optional)

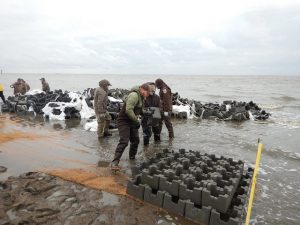
Photo: Rebuilding after Hurricane Sandy, U.S. Fish and Wildlife Service partners with the Nature Conservancy to erect “sand castle” barriers on Gandy’s Beach to protect Delaware Bay oyster beds from coastal erosion. Credit: Adrianna Zito-Livingston/The Nature Conservancy

Procedure

Safety Note: If using an electrical device to generate waves, keep the device far away from the water. Promptly clean up splashes to prevent slipping. Consider doing the wave tank part of this activity outside if the weather permits.

A. The Scenario
Your group is a coastal management engineering firm. You are competing with the other groups in your class for a contract from a town called Seaside. Over the past few years, Seaside’s sandy beaches have been eroding. You must develop a plan to help the town manage its erosion problem. Your plan must include modifying the beach in some way to address immediate erosion concerns. Your plan must also include at least two policies that do not physically alter the shoreline, but instead regulate human behavior.

Each of the major stakeholders (groups of people with an interest in the issue of coastal erosion) in town will vote on your idea. In order to win the contract, you must balance their competing interests. Your teacher may also give you additional criteria to consider, such as a specific budget or other feasibility constraints.

Seaside stakeholder concerns
Business Owners: Seaside depends on its beaches to bring tourists who will spend money in Seaside. Business owners are concerned that erosion is keeping tourists away. The business owners want a management plan that will solve the erosion problem as soon as possible and cost as little as possible.
Recreational Users: Surfers and swimmers in town are concerned about the erosion problem and whether it will get worse as a result of global warming and sea level rise. They want a management plan that is aesthetically pleasing (looks nice, but does not have to be all-natural) and does not alter the water dynamics too much (so they can keep doing their normal activities like surfing and snorkeling).
Environmentalists: An environmental group wants to protect the habitat of an endangered intertidal crab that lives on one area of the beach. They would prefer that hard structures not be built on the beach. They want a management plan that preserves the crab habitat, maintains natural features, and prioritizes the long-term health of the beach.
Property Owners: There are some houses near the beach. As the beach is eroding, these houses are at risk. The owners who live in these houses want to build a seawall or other hard structure to save their properties and will pay for half of the cost themselves. They want a management plan that will solve the erosion problem immediately.

Have a class discussion to come up with the criteria for determining the effectiveness of your engineering plan on controlling beach erosion, a concern of all of the stakeholders. The following are some erosion criteria to consider. Come to a class consensus on which of these criteria you will measure and how you will measure it. You may come up with criteria that are not on this list.

  1. The height of the coastline
  2. The width of the coastline
  3. The overall shape of the coastline
  4. The amount of sand pulled out to sea
  5. How far up the shore the waves reach

B. Set up standardized wave tanks

You will use a wave tank to develop and refine your coastal management strategies.

  1. (Optional) Wash the sand and rocks before the activity to remove fine particles that will make the water in your tank muddy.
  2. Fill the tank with water to about one-third full. The height of the water should be the same among all groups.
  3. Practice generating waves with a wind source or by displacing water using a paddle or other object. All groups should generate waves using the same method, they should have similar amplitudes and frequencies. Consider using a metronome to standardize wave frequency.
  4. Create a beach by carefully pouring sand into one end of the tank, so that a portion of the sand extends above the waterline. Standardize as many variables as possible, you may think of more than the following factors:
    1. The total amount of sand
    2. The height of the beach
    3. The width of the beach
    4. The location of the endangered crab habitat (mark with toothpicks)
    5. The number and location of the houses
  5. (Optional) Collect baseline data as a class in one of the tanks. This represents what will occur if nothing were done to the beach.
    1. Mark the shoreline with toothpicks.
    2. Sketch profile and top views of your coastline before generating waves.
    3. Measure things that correspond to your class beach erosion criteria (e.g., beach width)
    4. (Optional) Take “before” pictures of the wave tank and shoreline.
    5. Generate waves for 5 minutes. Try to keep the waves consistent in amplitude and frequency.
    6. Observe the wave patterns that are created. Make sketches of the wave patterns.
    7. At the end of the trial, draw profile and top views of the coastline. To observe changes in the shoreline, compare the location of the current waterline with the location of the toothpicks, which represents the location of the waterline at the beginning of the investigation.
    8. Measure things that correspond to your class beach erosion criteria (e.g., beach width)
    9. (Optional) Take “after” pictures of the wave tank and shoreline.

Photo: Bridgeton, N.J., student displays a full shell bag, one of 15,000 to be used to protect the Gandy’s Bay oyster beds. The bags will be placed offshore to create a 4,000 “living breakwater.” See U.S. Fish & Wildlife Service article HERE.

C. Develop Your Management Plan—Shoreline Modifications

  1. Choose a name for your coastal management engineering firm.
  2. In your group, discuss your ideas for managing Seaside’s erosion problems. You might consider multiple approaches in your plan to alter the shoreline. The following are some things you might consider:
    1. Building hard structures (some examples are in Table 5.12)
    2. b. Stabilizing the shore with “soft” non-structural techniques, for example, importing or shifting sand or planting vegetation
  3. Test your structural ideas in the wave tank following Part B Step 5. During this time while you are developing and improving solutions, you may choose not to follow all of the steps, or you may generate waves for less time than suggested.
  4. Collect final “before” and “after” data on your design plan by following all of the steps in Part B Step 5. The data you collect will be used in your presentation to stakeholders.
  5. When cleaning up, dry out the sand before storing it by spreading it out in a pan or on plastic tarps in the sun.
  6. Analyze and interpret your data.
    1. Compare your “before” and “after” data. How did the shoreline change? How much did it change?
    2. (Optional) Compare your “after” date to the “baseline” data collected in Part B. How did your plan compare to “doing nothing”?
    3. (Optional) If you took “before” and “after” pictures, analyze them to determine the difference in beach area (e.g., in cm2).

D. Develop Your Management Plan—Policies

  1. Based on your wave tank results, and applying what you know about human behavior, suggest two policies for Seaside to consider as part of your management plan.
    1. If your wave tank results show a weakness in your design, policies may be added to prevent that weakness from becoming a problem (e.g., not building in a certain area).
    2. Policies can also be used to help enforce an aspect of your plan that might not be desirable to all of the stakeholders. However, remember that if your policies are unrealistic, none of the stakeholders will vote for your idea.
  2. The following are some policy ideas—be creative in coming up with your own!
    1. Relocating structures to areas further away from shore (managed retreat)
    2. Buying-back houses that are too close to the shoreline, destroying the houses and relocating the owners
    3. Setting construction set-back limits
    4. Placing signs on dunes to stop people from walking on them

E. Communicate your management plan

  1. Plan with your group how you will present your design solution, including your policy suggestions, to the stakeholders.
    1. You will be given a set amount of time (e.g., 5 min) to present your design.
    2. Decide how you will present your idea: wave tank demonstration, computer presentation, flyers, etc.
    3. You may want to share your before and after pictures and make charts with your data.
  2. Communicate your management plan to the Seaside stakeholders. Your teacher might represent all of the stakeholders, other adults or students might role-play a representative from each stakeholder group, or everyone in the class might each be assigned to a stakeholder group.
  3. (Optional) Prepare a written engineering design proposal. Use this opportunity to refine your ideas, taking into account any feedback from the stakeholders.
Activity Questions: 
  1. Evaluate your proposed solution compared to other groups.
    1. How were different group proposals similar? How were they unique?
    2. Which proposal do you think met each of the four stakeholder’s needs best? Why?
  2. What policies did people suggest that went over particularly well? What policies did people suggest that were met with resistance? Why?
  3. What were the limitations of your proposal?
  4. How well do you think the wave tank modeled engineering designs in the real world? How could the model be improved?
  5. Were there things you could have changed to improve your design?
  6. How do seawalls, breakwaters, jetties, and other hard structures affect sand transport? What are the negative aspects of these structural stabilization strategies?
  7. How do natural ways of stabilizing the shoreline, such as restoring native plant habitats, protect the coast?
  8. List at least five reasons why it is important for people to protect beach areas from erosion.
  9. Many people want to live as close to the water as possible. Based on your studies, what guidelines would you give a prospective homebuilder who wants to purchase or build near to the water?
  10. The accretion, or build-up of sand where it does not normally occur, can be as detrimental as sand erosion. List at least five reasons why it may be important to people to protect against sand accumulation.

Additional resources

Research Reports

Protecting the Health and Well-being of Communities in a Changing Climate Proceedings of a 2017 National Science Foundation workshop (brief report).

Websites:

Coastal Erosion. National Oceanographic and Atmospheric Administration’s “climate resilience toolkit” includes effective strategies for dealing with coastal erosion and case studies.

Coastal Erosion Control Design. NewYork State’s Department of Environmental Conservation site.

Dune Grass Planting. NOAA video and article on effort to stabilize the beach at the Oceana Naval Air Station by planting panic grass.

Protecting our Coastline. Blog post primer on sea walls, jetties, groins, beach fences, and other methods of protecting shorelines by a Massachusetts civil engineer.

Shells and Students. U.S. Fish and Wildlife Service article on Project PORTS – Promoting Oyster Restoration through Schools – and building living reefs off of coastal New Jersey using bags filled with oyster shells.

Shoreline Engineering. Primer on “stabilizing the unstable” with jetties, groins, and other engineered solution.

U.S. Climate Resilience Toolkit. NOAA’s site includes case studies, such as restoring dunes in New Jersey after Hurricane Sandy to protect the shoreline, a guide to risk assessment, and ideas for taking action.


Videos:

Another Day of Fighting Beach Erosion on Australia’s Gold Coast. Popular seaside resort spends $20,000 a day on sandbags and other emergency measures to protect property. [YouTube 2:19]

Beach Erosion. Time-lapse video from Florida Institute of Technology’s wave tank showing the effects of waves and wind on sand. [YouTube 1:41]

Drone video of eroding seaside cliffs threatening Pacifica, Calif. [YouTube 6:02]

Erosion at the Beach. FunScienceDemos uses tub of sand and water to simulate erosion. [YouTube 3:32]

House on Cliff’s Edge Falling into Ocean! 2010 CNN report on Pacifica, Calif., home teetering on edge of rapidly eroding cliff. [YouTube 1:38] And the view in 2016.

King Tide Swamps La Jolla (Calif.) Aerial video of Nov. 26, 2015 tide that inundated La Jolla, California. [YouTube 1:12]

Methods Used to Slow Down Coastal Erosion. Short 2011 tutorial on engineered and sustainable ways currently used to ease coastal erosion. [YouTube 1:41]

What if your home was slipping into the ocean? National Geographic documentary about a community on North Carolina’s Outer Banks that is fighting erosion. [YouTube 4:49]

What is coastal Erosion? British Environment Agency explains the four major types of erosion. [YouTube 4:11]

Join ASEE for Top-Flight PD in Columbus!

Want to get your students excited about learning? Integrate authentic, hands-on engineering activities and projects into your curriculum!

Whether you seek fun, immediately useful ways to enrich your STEM, literacy, or art classes, or opportunities to network and learn alongside STEM teachers and engineering faculty from across the country, the American Society for Engineering Education’s annual PreK-12 Workshop is the place to be!

  • WHERE: Columbus Convention Center, Columbus, Ohio
  • WHEN: Saturday, June 24, 2017
    8:00 am – 5:00 pm 
  • REGISTER NOW! 

Certificate of completion will be provided at the end of the workshop (for continuing education credits).

All attending PreK-12 Teachers will receive a complimentary pass to ASEE’s Annual Conference & Exposition on Sunday, June 25 – including a workshop on Teaching Engineering through Making! 

New this year! Join us for a family engineering event at Ohio State University.

Back by popular demand: The PreK-12 Curriculum Showcase – All educators are invited to share their original ideas and innovative models that show how they integrate engineering and STEM.

Log into your account now and REGISTER NOW! If you don’t have an account, sign up to create your username and password. Once logged in, click “Upcoming Workshops” and begin your registration!

Registration Rates

  • PreK-12 Teacher ASEE member: $35
  • PreK-12 Teacher non-ASEE member: $75
  • Non-teacher member and Non-members + One year PreK-12 ASEE Membership & Precollege Division membership: $125

Sessions include:

  • Seeds of STEM: A problem-based curriculum for early childhood education classrooms presented by Worcester Polytechnic Institute;
  • Code & Chords, St. Thomas University’s coding and music tech activity based on a summer camp  for middle and high school students;
  • West Point’s Harnessing the Wind;
  • Boise State’s interactive classroom experiences that promote success in first-year college engineering courses.

Click HERE for the program schedule. (Enter Saturday, June 24 as date to see individual sessions.)

For more information, contact Lisa J. Jennings, Manager, PreK-12 Activities at prek12workshop@asee.org.

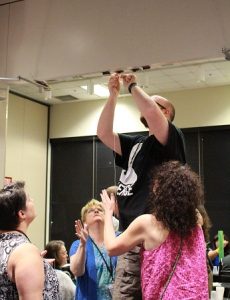
Photos of 2016 PreK-12 Workshop in New Orleans by ASEE’s Michelle Bersabal

Carpe Noctem: Dark Sky Movement

Light pollution makes it hard to gaze at the stars, but does it also affect the environment and public health?

That’s one of the items on the research agenda of the world’s first academic center dedicated to discovery, communication, and application of knowledge about the quality of night skies.

Housed at the University of Utah’s College of Architecture and Planning, the recently formed Consortium for Dark Sky Studies will bring together an interdisciplinary group from more than 25 universities, industries, and community and government partners to examine the impact of light pollution. The consortium already has several activities planned to mark International Dark Sky Week (April 22 – 28, 2017), an event started by a high school student in 2003, including a Salt Lake City walk and citizen science event. The consortium also has teamed up with ALAN (Artificial Light at Night) to co-host its 2018 global research conference.

A century ago, dark night skies were the norm, even in cities. Now, according to scholars who developed the ground-breaking 2016 World Atlas of Artificial Light Night Sky Brightness, 80 percent of the world’s population – and 99 percent of Americans and Europeans – live under sky glow. Only a handful of dark places remain, including remote parts of northern Sweden. The New Wotld Atlas of Night Sky Brightness, from the University of Colorado, includes a 3-D globe version. The researchers also found that replacing streetlamps with LED bulbs will increase light pollution, because the energy-saving bulbs are brighter than conventional ones.

A growing body of evidence has linked the brightening night sky to such measurable effects as:

How bad is light pollution where you live?

This interactive map created from the”World Atlas” data or the NASA Blue Marble Navigator for a bird’s eye view of the lights in your town. Google Earth users can download an overlay also created from the “World Atlas” data.

The National Oceanic and Atmospheric Agency (NOAA) has time-lapse videos showing the increase in nighttime illumination  over Hong Kong and other regions.

You Can Help!

The good news is that light pollution, unlike many other forms of pollution, is reversible and each one of us can make a difference! You can start by taking these simple steps:

  • Learn more. Check out the International Dark Sky Association’s Light Pollution blog posts
  • Contribute observations to the Globe at Night citizen-science project
  • Find and visit a dark sky area near you
  • Check out the National Park Service’s Night Skies resources – and maybe book a trip to the Grand Canyon or other dark-sky spot
  • Watch Carnegie Mellon University astronomer Diane Turnshek’s TED Talk describing Pittsburgh’s efforts to cut light pollution
  • Only use lighting when and where it’s needed. Check out the Quality Lighting Teaching Kit from the National Optical Astronomy Observatory, which includes videos.
  • If safety is concern, install motion detector lights and timers
  • Properly shield all outdoor lights
  • Keep your blinds drawn to keep light inside
  • Become a citizen scientist and helping to measure light pollution
  • Join NASA’s Night Sky Network of amateur astronomy clubs


“Adopt” a Piece of the Planet

There are many ways to celebrate Earth Day 2017, from planting a tree to marching for science, but few top NASA’s Adopt a Planet Day for an out-of-this-world activity.

The space agency invites people from around the globe to virtually “adopt” one of 64,000 individual pieces of Earth as seen from space. The space agency continually looks outward to discover and learn about planets in our solar system and beyond, but none is better studied than the one we actually live on. NASA has a  fleet of 18 Earth science missions in space, supported by aircraft, ships, and ground observations, that measure aspects of the environment that touch the lives of every person around the world.

Adopt a Planet participants will receive personalized adoption certificates featuring data from NASA’s Earth-observing satellites for a randomly assigned location that can be printed and shared.

Meanwhile, anyone can explore other locations with NASA’s interactive map and get even more Earth science data from NASA’s Worldview website.

ASEE’s Inclusive Engineering Media Contest


Share how you engage diverse students in inclusive engineering and compete to win a $1,000 travel award to attend the 2017 American Society for Engineering Education’s Annual Conference in Columbus, Ohio, June 24 – June 28, 2017.

ASEE celebrates and promotes diversity and inclusion in engineering, and aims to expand access to every student. The Pre-college Engineering Education Division seeks to highlight examples of inclusive engineering through an exciting, creative, and rewarding social media. Follow along using #PCEEChallenge.

Beware! You might earn some bragging rights and tons of likes/shares, though you will most definitely increase awareness of the importance of inclusive engineering, and that’s what most rewarding!

Learn More and Submit by May 1.

Objective: Share your best practices and strategies that demonstrate inclusion, educational equity, and diversity in teaching pre-college engineering via websites, reddit, twitter, YouTube, Facebook, Instagram, etc. or across all platforms.
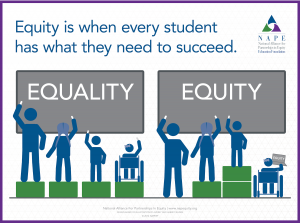

Format: Video, essay, podcast, infographic, blog, photo essay — basically any form of media that meets the objective.


Tag and Like Us!  Twitter: @ASEE_DC, @ASEEK12Division
Facebook: https://www.facebook.com/AseeK12Division

Include this hashtag: #PCEEChallenge

Prize: The winner will receive $1,000 for travel expenses to the 2017 Annual ASEE Conference in Columbus, OH. (Paid as a reimbursement from actual receipts.)NAPE_EqualityVEquity_Infographic_FNL copy

The mission of the Pre-college Engineering Education (PCEE) division of ASEE is to grow and sustain a community whose members collectively build expertise and capacity in pre-college engineering education knowledge and practice.

STEM PD: Integrating Engineering Design

  • What: Lever Engineering Core Program – Engineering Design in the K-12 Classroom, presented by Knowles Science Teaching Foundation and ASEE
  • When: June 26-30, 2017 – River Falls, Wisconsin ($800)
  • When: July 22-26, 2017 – Philadelphia, Pennsylvania ($1,000)

Fee includes a year of follow-up coaching, professional learning community, and virtual hangouts before and after you teach your design lesson. Scholarships available.

REGISTER by June 15, 2017.

Click HERE for details and flyer.

Engineering design challenges can provide engaging ways to enrich students’ math and science learning, but what is engineering design and how can teachers integrate it in their classrooms, as the Next Generation Science Standards require?

Find out at these week-long, immersive professional learning courses offered by the Knowles Science Teaching Foundation and the American Society for Engineering Education. 

Participants must attend with a colleague and together they will:

  • Do content-rich, authentic engineering design challenges.
  • Analyze real student work and practice facilitating your own engineering design challenges
  • Plan and teach a lesson together on site.

KSTF is a non-profit organization dedicated to providing new math and science teachers with professional development, resources and support
to improve STEM education in our schools. Key features of KSTF professional development services include teachers as facilitators and coaches.

ASEE is a 124-year-old professional society dedicated to advancing all disciplines of engineering and engineering technology education from preschool through graduate school.

STEM Teacher Retreat in AggieLand!

  • What: Aerospace Engineering: Designing and Building Machines that Fly
  • When: June 19-23, 2017  (check in Sunday, June 18)
  • Where: Texas A&M, College Station campus; housing at the spacious White Creek Apartments
  • Cost: $1,350, inclusive of housing, meals, and transportation from White Creek Apartments to campus.
  • Register by May 31, 2017

Join Texas A&M and the American Society for Engineering Education for the inaugural offering of an innovative, immersive summer professional learning program designed to help you integrate the “E” into your STEM classes.

Participants will use the engineering design process to build a flying machine under certain constraints. They then they will collaborate to develop a lesson series based on that experience at an appropriate level for their classes. While the workshop is aimed at middle and high school teachers, elementary educators will find the experience useful and rewarding.

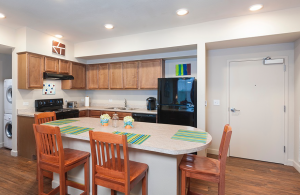
Accommodations at the spacious White Creek Apartments (photo, right) feature outdoor grills – extending the opportunities for teachers to engage with and learn from each other in a beautiful setting.
Two online follow-up sessions will help support implementation and update participants on the project’s processes, failures, and eventual successes.

Click HERE to register or for information on other Aggie STEM 2017 teacher workshops and boot camps.

Click HERE for ASEE’s Standards for the Preparation and Professional Development for Teachers of Engineering and other ASEE teacher professional development resources.

Click HERE to take a virtual-reality tour of Texas A&M’s campus.

Texas teachers will earn continuing professional education (CPE) credits for participation in the workshop, and all teachers will receive a certificate documenting the professional development hours of the program.

Questions? Contact Aggie STEM at 979-862-4665 or aggiestem@tamu.edu

Aggie STEM has been providing professional development in STEM areas for 10 years and serving districts with customized PD for more than 20 years, both in individual disciplines as well as through integrated STEM approaches that help teachers see how their individual content connects with other disciplines.

ASEE is a 124-year-old professional society dedicated to furthering engineering and engineering technology education across all disciplines, preschool through graduate school.

Measuring Light Pollution

Activity courtesy of TeachEngineering, contributed by the AMPS GK-12 Program, Polytechnic Institute of New York University.

Grade Level: 6-7

Time: 45 minutes

Note: Requires the use of reusable LEGO MINDSTORMS NXT intelligent bricks and sensors;

Summary:

Students in grades 6-7 build light meters and investigate the nature, sources, and levels of light in their classroom environment. They learn about the adverse effects of artificial light on humans, animals, and plants as well as the engineering concepts of sensors and lumen and lux (lx) illuminance units. They also learn how to better use light and save energy as well as some of the technologies designed by engineers to reduce light pollution and energy waste.

Engineering Connection

Creating and controlling light is a great engineering achievement. Engineers develop artificial sources of light to satisfy specific requirements including good luminance, energy savings, and light fixture design that appropriately directs and reflects light, reduces light waste and minimizes light invasion. The modern complexity of light installation in buildings and outdoor venues requires the expertise of lighting/illumination engineers to design for specific needs and optimize power consumption. In this activity, the lux meter built and used by students is an example of a device that connects electrical engineering and computer science. The activity provides mathematics practice in recording, plotting, and analyzing data, mirroring how engineers collect and analyze data to solve real-world design challenges.

Learning Objectives

After doing this activity, students should be able to:

  • Explain and identify light pollution and understand how engineers measure light intensity.
  • Describe and list examples of adverse effects resulting from light pollution.
  • Describe and list solutions proposed by engineers to address light pollution.
  • Construct a light level meter to record light intensity in the classroom.
  • Plot and analyze collected data.

Learning Standards

Next Generation Science Standards

Define the criteria and constraints of a design problem with sufficient precision to ensure a successful solution, taking into account relevant scientific principles and potential impacts on people and the natural environment that may limit possible solutions. [Grades 6 – 8]

Common Core State Mathematics Standards

  • Represent and interpret data. [Grade 5]
  • Display numerical data in plots on a number line, including dot plots, histograms, and box plots. [Grade 6]
  • Summarize numerical data sets in relation to their context [Grade 6]
  • Construct and interpret scatter plots for bivariate measurement data to investigate patterns of association between two quantities. Describe patterns such as clustering, outliers, positive or negative association, linear association, and nonlinear association. [Grade 8]

International Technology and Engineering Educators Association

  • Students will develop an understanding of the relationships among technologies and the connections between technology and other fields of study. [Grades K – 12]
  • Students will develop an understanding of the effects of technology on the environment. [Grades K – 12]

Materials List

Each group needs:

Introduction/Motivation

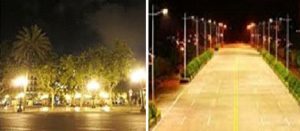
Examples of bad (left) and good (right) lighting orientation. Good lighting orientation reduces light pollution.

What is light pollution? Artificial light produced by incandescen
ce bulbs, fluorescent tubes and compact fluorescent lights has changed the world and enabled people to operate in the absence of sunlight, but light pollution is the side effect of the human-generated lighting created in industrial civilizations. The benefits of these artificial sources of lighting come with consequences such as poor lighting design that allows artificial light to shine outward and upward into the sky where it is not wanted, instead of directing it downward, where it is needed. In addition, the increased need for domestic and public lighting requires the burning of more fossil fuel, which generates other types of pollution such as carbon dioxide and greenhouse gas emissions. For that reason, energy waste is also considered part of light pollution.


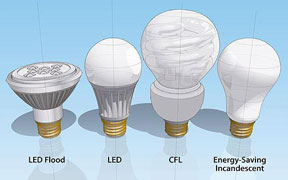
How does light pollution relate to engineering? Light pollution is a recognized concern in urban and suburban areas for many reasons, including the fact that it obscures our vision of the night sky. Light pollution negatively affects the astronomy, aerospace and astrophysics experiments conducted by scientists and engineers. To address light pollution, electrical engineers and lighting (illumination) engineers design efficient and intelligent light fixtures and systems that save energy and better direct light towards where it is needed. Intelligent lighting design and energy saving is now the standard objective in the industry fabrication of new lighting sources and systems. Civil engineers and architects include this approach in almost all new building designs. A compact fluorescent lamp (or light) (CFL) is one example of an efficient illumination product that engineers have designed. A CFL produces light with the same power as several bulbs combined together and uses less energy. Energy Star lighting fixtures, lanterns and spotlights make use of geometry and optical design to optimize light directing and reduce the number of bulbs needed. Advances in light-emitting diode (LED) technology enable it to be used as an energy-saving source of domestic, vehicle and commercial lighting. Computerized lighting systems are programmed to continually sense and adjust the amount of artificial light provided depending on the varying amount of natural light present.

Definitions and measurement: Light pollution refers to misdirected and misused lighting. Light pollution is the result of poorly designed outdoor lighting fixtures that send unwanted and/or unnecessary light into adjacent areas, and increase the ambient light level of the night sky. Inefficient lighting also consumes more power, contributing to society’s overall energy need. The primary unit of measure in photometry is lumen (lm), which is a measure of light perceived by the human eye. It is different from the watt (W), which is a measure of electrical power used by the lamp. A lux (lx) is a unit of illumination equal to 1 lumen per square meter and the candela (cd) is the basic SI unit of luminous intensity.
What are types of light pollution and side effects? Light environmentalists identify four types of light pollution. The first is sky glow, which is defined as light wastefully escaping into the night sky. The glows over urban or suburban communities that result as a consequence have considerably changed the clarity of the night sky view and interfere with scientific observation of the stars. The second type is glare, which is light shining dangerously into people’s eyes, causing viewing discomfort and reduced night vision that can play a part in roadway accidents. The third type is light trespass, which refers to light from a source directed towards an adjacent property or lighting of an area that would otherwise be dark. The fourth type is energy waste, which refers to inappropriate use of light or appliances that increase the energy demand, and hence, the consumption of fossil fuels to generate electricity.
What are the threats to humans and the environment? Light pollution can cause sleep disorders in humans and alter the metabolism mechanism that can result in diseases such as cancer. Researchers from the National Cancer Institute and the Aviation Space Environmental Medicine have found that an elevated breast cancer risk is associated with occupational exposure to artificial light at night and the International Agency for Research on Cancer has classified shift work as a probable human carcinogen. Light pollution also alters the behaviors of many other species of animals, including birds, insects and sea turtles, and causes significant adverse impacts to ecosystems such as interruption of certain animal migration and navigation, alteration of predator prey interactions, interference with plant and animal circadian rhythms, and fundamental metabolic interference with component species.
What is the appropriate intensity of light needed in our classroom? In today’s activity, you will build light meters using LEGO MINDSTORMS NXT intelligent bricks and light sensors to measure the light intensity in our classroom in different lighting scenarios.

Vocabulary/Definitions

  • candela (cd): The SI (International System of Units) unit of luminous intensity.
  • energy waste: Inappropriate and/or inefficient use of artificial light or energy-using appliances.
  • environment: The air, water and land in or on which people, animals and plants live.
  • glare: Light shining brightly into people’s eyes.
  • light meter: A device that measures the visible light intensity.
  • light pollution: Misdirected and/or misused artificial light.
  • light trespass: When artificial light is directed towards someone else’s property that is not intended to be lighted.
  • lumen (lm): A measure of light perceived by the human eye.
  • lux (lx): A unit of illumination equal to 1 lumen per square meter.
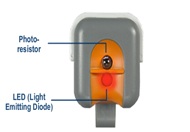
  • photo resistor: A light sensor.
  • photometry: The science of measurement of light’s brightness.
  • pollution: Unwanted and undesirable contaminants in the natural environment.
  • sensor: A device that converts a physical quantity into an electrical signal.
  • sky glow: The resulting sky illumination when artificial light wastefully escapes into the night sky.
  • watt (W): A measure of electrical power.

Procedure

Background

In this activity, students build light meters using LEGO MINDSTORMS NXT intelligent bricks and light sensors and then measure light intensity in the classroom. A light sensor converts a physical quantity into an electric signal that can be read and interpreted by the LEGO intelligent bricks and a software program is used to display the light intensity. Students measure the intensity of light in their classroom and see why it is important to turn off the lights on a sunny day or when on no one is using the room. Students are introduced to some vocabulary words used in photometry, which is the science of measurement of light’s brightness. Students also learn about sensors that convert physical quantities to electrical signals and they are introduced to computer science through the software that operates the light meter.

Before the Activity

  1. Gather materials and make copies of the Measuring Light Pollution Pre-Activity Survey and Measuring Light Pollution Worksheet. As necessary, modify the worksheet in accordance with your classroom lighting situation (or use other lighting sources) with the idea to create at least four types of classroom lighting conditions that will generate data showing an increasing light intensity.
  2. Set the system in place by making sure all the components are connected to the appropriate ports (touch sensor to port 1, light sensor to port 3) of the LEGO NXT intelligent brick.
  3. Check to make sure the battery level is good.
  4. Calibrate the light sensor: In a dark room, follow these three steps:
  • Run the program lightMeter.rbt.
  • Press the button attached to the touch sensor to start recording data (the light level).
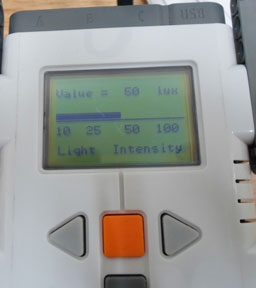
  • The screen must display zero lux.

Note: The NXT light sensor can measure light intensity on a scale from 0 to 100; 0 is the weakest intensity and corresponds to the total absence of light, while 100 is the strongest intensity. The light-intensity under a desk measures approximately 20, while the light-intensity of a fluorescent light is approximately 85. The noon sunlight must be at 100, the maximum value.

With the Students: Measuring light level

  • Before doing anything else, administer the pre-activity survey.
  • Present to students the Introduction/Motivation material.
  • Divide the class into groups of three students each.
  • Hand out the worksheets. Have students answer questions 1 and 2 on the worksheets before mounting the light sensors and operating the light meter.
  • Give the groups all the necessary materials and have them repeat steps 2 and 3 of the “Before the Activity” steps.
  • Open the lightMeter.rbt program on your computer (if for any reason the sensor ports are changed, please do so in the program).
  • Connect the USB cable and upload the program onto the LEGO brick.
  • Run the program on the LEGO brick by selecting the correct program and pressing the orange button twice.
  • Start recording the light intensity by pressing the touch button.
  • Note that while the program executes, the amplitude of the measured light is instantaneously displayed and also saved to a file.
  • When the program ends, students compare their results with the average standards on the same type of light.
  • The lux meter measurements may differ from the values printed on the bulbs or fluorescent tubes. Engineers attribute any differences to variables such as the distance from the lighting source, the angle of inclination of the light sensor from the lighting source, the current intensity powering the lighting source and the ambient conditions, such as the presence or absence of sunlight. Inform students that professional measurement instruments are very expensive and operated by highly trained engineers or technicians in well-defined conditions. Thus, some error is anticipated in this activity due to using less precise measuring devices in an environment that is more difficult to control with students learning to use instruments.
  • Students plot their data as line charts using graph paper and an appropriate scale.
  • Students analyze the data based on the plot and answer the worksheet questions. Hand in the worksheets for grading.
  • Through a class discussion, have students share results and draw conclusions about the patterns observed in their data and graph. Also recap the types of light pollution and the technologies developed by engineers to reduce light pollution and be more efficient with energy usage. Ask students to describe what they could take to reduce light pollution at school and at home. See additional questions in the Assessment section.
    Attachments

    Troubleshooting Tips

    Make sure the equipment is set up correctly, the battery levels are good and sensors are connected to the correct brick ports.

    Make sure the lightMeter.rbt is running.

    Always calibrate the sensor before gathering data.

    Refer to the NXT website for any other issues

    Assessment

    Pre-Activity Assessment

    Pre-Activity Survey: Before providing any information, ask students to complete the Measuring Light Pollution Pre-Activity Survey to the best of their abilities. Reassure students that this is not for a grade so they feel comfortable writing down their ideas, even if they are unsure. Tell them that even if they do not know all the answers at the start of class, they will know them by the end of the activity. Review students’ answers to gauge their baseline understanding of the subject matter.

    Informal Discussion: Ask students some questions about the subject matter, covering the questions and correct answers to the pre-activity survey. Refer to the Measuring Light Pollution Pre-Activity Survey Answers and Vocabulary/Definitions section. Ask the students:

    • What is pollution? Have you ever heard about light pollution? What is light pollution?
    • What tools might we used to measure visible light intensity?
    • What unit of measure do we use to measure light level?

    Activity Embedded Assessment

    Analysis: While the experiments are being conducted, have students complete the Measuring Light Pollution Worksheet by recording data, answering questions and drawing line graphs. Ask students to comment on the procedure to measure the light intensity during each experiment trial. To make sure the graph is completed correctly, ask students what they must display on the horizontal axis and what they must display on the vertical axis. Check that students use an appropriate scale that can fit all the collected data. Review students’ worksheet answers, data and graphs to gauge their comprehension.

    Post-Activity Assessment

    Formal Discussion: To gauge student comprehension, ask them to explain the entire procedure in their own words, as if they were explaining the activity to a family member. Ask the students:

    • Explain light pollution, its various types, the unit used to measure light intensity, and the measurement tools used to measure light levels. Expect students to be able to cite at least two types of light pollution (sky glow, glare, light trespass, energy waste: light in an unoccupied room), two side effects of light pollution (altering night sky viewing in big cities, cancer, light invasion, altering animal reproduction and behavior) and two manufactured products that reduce light pollution (light fixtures, energy-efficient bulbs such as CFLs and LEDs).
    • What are the roles of each experiment component (the light sensor, brick, program and graph)? Expect students to explain that the light sensor captures the light intensity and transforms it into an electric signals that are analyzes and transformed into numerical value by the brick (the computer/brain). The program contains the set of instructions to tell the brick how to capture, analyze, store and display the light intensity. The graph is a visual representation of the data and helps us to understand the data by seeing any patterns, similar to what engineers do every day.

    References

    Bullough, John D. Energy-Efficient Street Lighting in New York State. 2002. NYSERDA: New York State Energy Research and Development Authority. Accessed May 28, 2013.

    Hölker, Franz, C. Wolter, E. K. Perkin, and K. Tockner. 2010. “Light pollution as a biodiversity threat.” Trends in Ecology and Evolution. 25: pp. 681-682. Accessed May 28, 2013. http://nbcgib.uesc.br/ckfinder/userfiles/files/texto%20prova%20ingles.pdf

    Hurley, Susan, David Nelson, Andrew Hertz and Peggy Reynolds. 2012. “P-188: Indoor and Outdoor Light Pollution and the Risk of Breast Cancer.” Epidemiology. Vol. 23, Issue 5S, September, pp. S-593.

    Mizon, Bob. “Adverse Impacts of Inefficient Artificial Lighting.” Chapter 3 in Light Pollution. New York, NY: Springer Science+Business, 2012, pp. 53-75.

    Pendoley, Kellie, Arwini Kahlon, Robert Ryan and Jeremy Savage. 2012. “A Novel Technique for Monitoring Light Pollution.” International Conference on Health, Safety and Environment in Oil and Gas Exploration and Production, Society of Petroleum Engineers. September 2012, Perth, Australia

    Additional Resources

    International Dark Sky Association. Site includes a blog and information for marking International Dark Sky Week in late April.

    Carpe Noctem: Dark Sky Movement. eGFI Teachers’ feature on world’s first academic research center devoted to the impact of nocturnal light pollution includes links to resources to mark International Dark Sky Week.

    On Light Pollution: The End of Darkness. New Yorker YouTube Channel video [5:35]

    A World Without Light Pollution. YouTube video [1:35] showing cities with the Milky Way.

    Dark Skies Awareness.

    Contributors

    Violet Mwaffo, Jerib Carson, and Qianqian Lin at the Madiba Prep Middle School

    Copyright

    © 2013 by Regents of the University of Colorado; original © 2012 Polytechnic Institute of New York University

    Supporting Program

    AMPS GK-12 Program, Polytechnic Institute of New York University

    Acknowledgements

    The development of this activity was supported by the Applying Mechatronics to Promote Science (AMPS) Program funded by National Science Foundation GK-12 grant no. 0741714. However, these contents do not necessarily represent the policies of the NSF and you should not assume endorsement by the federal government.

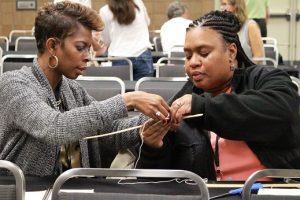
    Photo credits: Cover image by Nate Pesce pictures Altramesia Grady, Energy and Electric Engineer with with Fort Meade, showing kids from Monarch Academy in Glen Burnie how a device measures light from LED and fluorescent lightbulbs during Earth Day celebration at the Fort Meade Pavilion, April 28, 2016.  Light meter image copyright Violet Mwaffo, Polytechnic Institute of New York University. Light bulb graphic copyright the U.S. Department of Energy. LEGO meter copyright LEGO.