


Measuring Water Quality to Assess Human Impact
Lesson courtesy of Microsoft Education’s Hacking STEM. See full instructions at aka.ms/electrolessonplan.
Grade level: 5 – 8
Time: Six 50-minute class periods
Summary
Middle school students explore how fertilizers and other solids that dissolve in water impact water quality by building and using sensors to measure the electrical conductivity of water samples. They then create data tables and investigate possible sources of pollutants using digital visualization tools.
Learning objectives
After doing this activity, students will understand and be able to:
- Build analog and digital electrical conductivity (EC) sensors using instructions.
- Calibrate the sensor by analyzing proportional relationships using Excel.
- Measure the electrical conductivity of water samples to investigate possible sources of pollutants using data visualized with digital tools.
21st century technical skills
- Mechanical engineering
- Electrical engineering
- Software engineering
- Data science
Learning Standards
Next Generation Science Standards
Performance Expectation (MS-ESS3-3)
- Apply scientific principles to design a method for monitoring and minimizing a human impact on the environment.
Science and Engineering Practices
- Constructing explanations and designing solutions in 6–8 builds on K–5 experiences and progresses to include constructing explanations and designing solutions supported by multiple sources of evidence consistent with scientific ideas, principles, and theories.
- Apply scientific principles to design an object, tool, process or system.
Disciplinary Core Ideas
ESS3.C: Human Impacts on Earth Systems
- Human activities have significantly altered the biosphere, sometimes damaging or destroying natural habitats and causing the extinction of other species. But changes to Earth’s environments can have different impacts (negative and positive) for different living things.
Crosscutting Concepts
Influence of Science, Engineering, and Technology on Society and the Natural World
- All human activity draws on natural resources and has both short and long-term consequences, positive as well as negative, for the health of people and the natural environment. (MS-ESS3-1),(MS-ESS3-4)
International Society for Technology in Education (ISTE)
- 3d – Students build knowledge by actively exploring real-world issues and problems, developing ideas and theories and pursuing answers and solutions.
- 5b – Students collect data or identify relevant data sets, use digital tools to analyze them, and represent data in various ways to facilitate problem-solving and decision-making.
Common Core State Standards: Mathematics
- Analyze proportional relationships and use them to solve real-world and mathematical problems.
- Decide whether two quantities are in a proportional relationship, e.g., by testing for equivalent ratios in a table or graphing on a coordinate plane and observing whether the graph is a straight line through the origin.
- Summarize numerical data sets in relation to their context.
- Summarize such as by: reporting the number of observations, describing the nature of the attribute under investigation, including how it was measured and its units of measurement, giving quantitative measures of center (median and/or mean) and variability (interquartile range and/or mean absolute deviation), as well as describing any overall pattern and any striking deviations from the overall pattern with reference to the context in which the data were gathered, and relating the choice of measures of center and variability to the shape of the data distribution and the context in which the data were gathered.
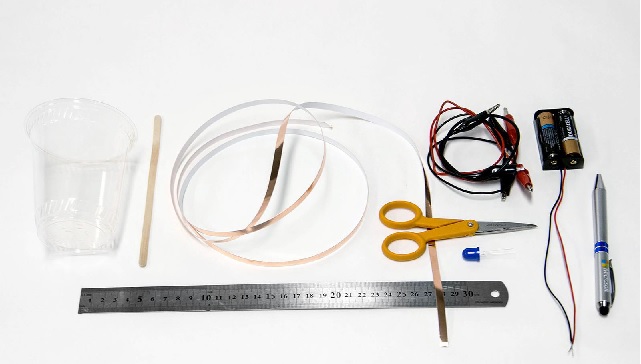
Materials
Click HERE to calculate materials for your group’s size.
For each student or team: Click for illustrated sensor assembly instructions.
- Student workbook [PDF] [Word]
- plastic cups 7
- breadboard 1
- point 1
- Jumbo LED 1
- Drinking straws 1
- double sided alligator clips 3
- pin-ended alligator clips 2
- stainless steel wire (28 gauge, 17 cm long) 2
- copper tape 10-cm strip 2
- coffee stir sticks 3
- 100-Ohm resistor 1
- de-ionized water, 1 gallon jug 6
- baking soda 1
- EC meter 1
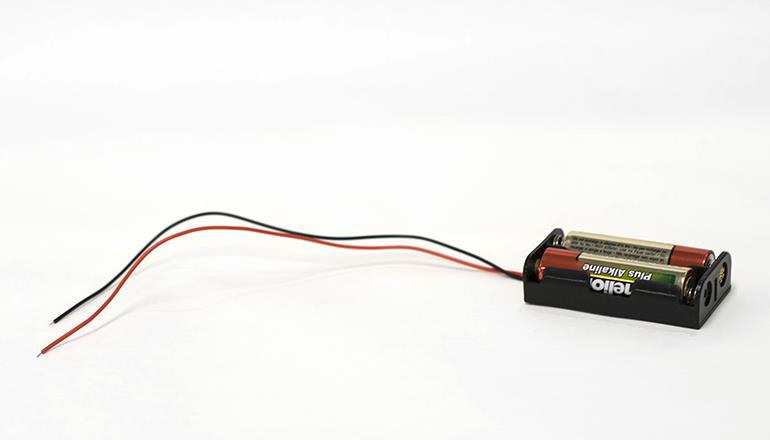
- AA batteries 2
- AA battery holder 1
- adhesive tape 1
- hot glue gun + glue sticks 1
- wire strippers 1
- thermometer
- marker
- scissors
- pin-ended breadboarding jumper wires 3
- Arduino unit microcontroller 1
- USB cable type A to type B
- micro:bit controller 1
- USB cable type A to Micro B 1
- micro:bit edge connector 1
Safety tips
- Wear appropriate eye protection
- Keep sharp edges of cutting tools away from body and fingers, and always cover blade when not using.
Procedure
Before teaching lesson:
- View the Measuring Water Quality to Monitor Human Impact introduction video to get an overview of the activities for the project.
- Acquire the lesson Build Materials.
- Prepare calibration solutions using the Instructions.
- Complete each step of the lesson instructions in advance of teaching the activity in order to determine unforeseen challenges that may arise with their students.
- The following is a list of items that could be tested in Part 1 of the Student Journal using the analog EC sensor:
- piece of leather
- paper clip
- soda can
- plastic cup
- dry salt
- pin wire
- If you choose to complete Part 5 of the Student Journal, ask students to bring in water samples a few days in advance.
- Confirm that students have web access to all the links in the lesson.
- Confirm that each student computer has all required software:
- Arduino IDE or micro:bit Serial Driver
- Data Streamer add-in
- Excel workbook
- Windows 10
- Office 365 must be updated. Students and teachers are eligible for Office 365 Education, which includes Word, Excel, PowerPoint, and OneNote, plus additional classroom tools.
- Practice downloading/flashing the micro:bit or Arduino depending on which microcontroller you are using.
- For Arduino, make sure you walk through the process of adding this device to the IDE as it does not automatically pop-up.
- For micro:bit, make sure your device appears as a USB storage device and that you are able to copy .hex files on to it.
- Familiarize yourself with the Excel workbook and Data Streamer add-in.
Pacing guide
Day 1 – prior knowledge, vocabulary, role assignment
- Introduce the challenge using the introduction video, Student Introduction and the lesson learning objectives.
Welcome young scientists and engineers!
You have been invited to participate in an important environmental impact study.
Fish populations have been declining in a local watershed. In recent years, human activity in this region associated with farms, roads and industrial complexes has been increasing. As a result, members of a local Citizen’s Stream Watch group are conducting research to investigate possible causes of the decline.
Your mission:
Join the Citizen’s Stream Watch group to conduct an initial survey of water quality. Investigate the electrical conductivity of water samples from the region’s rivers and streams to determine possible source sites of pollutants that might be negatively impacting fish populations. Your contribution has the potential to positively impact the health of ecosystems and benefit future generations.
Good luck!
- Demonstrate a working digital EC sensor and the Excel visualization.
- Students answer the Prior Knowledge questions in Student Journal [Click HERE for PDF] without referencing outside resources.
- Conduct small group and whole class discussion on the Prior Knowledge questions and their answers.
- Students complete definitions for Vocabulary words.
- Assign Group Roles:
Mechanical engineer
- Manufacturing related design
- Gathers materials and tools
- Cleans workspace, returns materials and tools
Electrical engineer
- Designs circuits
- Connects to a power source
- Wires electrical components
Software engineer
- Designs and analyzes code structure
- Programs
- Debugs and tests
Data scientist
- Designs data dashboard
- Collects data
- Analyzes data
Day 2 – Analog data
- Students construct the analog EC sensor [PDF with illustrated step-by-step instructions] for everyday (dry) materials.
- Students complete the Electrical conductivity of everyday (dry) component in Part 2 of the Student Journal.
- Students construct the Electrical conductivity of liquids (solutions) component [PDF with illustrated step-by-step instructions] in Part 2 of the Student Journal.
- Students complete remaining items in Part 2 of Student Journal.
Day 3 – Digital data
- Students construct the digital electrical conductivity sensor using Instructions. (Pages 10-15 show illustrated instructions.)
- Students complete corresponding questions in Student Journal.
- Students complete wiring and breadboarding of the digital EC sensor.
- Students flash code to the microcontroller.
Day 4
- Students calibrate the Digital EC sensor using Instructions.
- Students complete Part 3 of Student Journal.
Day 5
- Students model a hydrologist collecting field samples for an environmental impact study.
- Teacher determines the amount of solute in each solution site cup. Students use their EC sensor to measure the dissolved salts in PPM of samples that correspond to the sites on the model watershed.
- Students report their findings to their classmates.
Field Data (Optional)
- Teachers may wish to have students conduct studies within their local community. The Excel water sample worksheet from this lesson is a great way to organize data for short-term and long-term studies.
Part 4: Reflection
- Complete and discuss the reflection questions in the Student Journal. Discussion should be framed in the context of teams of hydrologists reporting data to their supervisor.
Activity extensions
Science
- Complete a formal lab report that tests the influence of increased baking soda in water on the electrical conductivity of the solution.
- Design a testing procedure that compares the electrical conductivity of several different commercially packaged drinks.
- Research different types of salts and common source sites that cause water pollution.
Technology
- Research and present other types of sensors used to collect data on water quality.
Engineering
- Use the Design loop to design and test a DIY filter that removes dissolved ionic compounds from water. Use your EC sensor to test the TDS in PPM before and after sampling.
- Research commercial scale water filtration systems and report back on three different systems and their use around the world.
Art
- Create a poster to raise awareness of a fish population that is declining due to water pollution or loss of habitat.
- Design a logo for your group’s Stream Team.
Math
- Use an everyday object to describe parts per million.
- Describe why PPM can also be expressed as mg/L and kg/L. In what circumstances would mg/L and kg/L be used as a unit of measure?
Additional curriculum and lessons
Fresh Water Lesson Plans. A large list of websites with K-12 lessons and activities about watersheds and water quality from Fresh Water Live
How Clean is That Water? TeachEngineering design activity for students in grades 5 to 7.
Sense It! The Student Enabled Network of Sensors for the Environment using Innovative Technology is a free, four-module middle or high school curriculum that can be inserted into any standard STEM course (mathematics, chemistry, general science, physics, environmental science and computer science) to meet national education standards. It grew out of National Science Foundation-funded research conducted by ASEE member Liesl Hotaling, then an educator in the University of South Florida’s marine biology department.
Stormwater Management Lesson Plans for Grades 3 – 12. The University of Maryland developed this Green Infrastructure as Outdoor Environmental Laboratories: Urban Water Quality Training in Primary and Secondary Schools under a U.S. Environmental Protection Agency grant.
National Field Manual for the Collection of Water Quality Data. U.S. Geological Service’s guide for sampling water quality and reporting data.
How to Do Water-Quality Sampling. Video from New Zealand Landcare Trust shows how to take water samples. [YouTube 3:53]
Filed under: Class Activities, Grades 6-8, Grades 9-12, K-12 Outreach Programs, Lesson Plans
Tags: arduino, Class Activities, data analysis, electrical circuits, Electrical Engineering, Environmental Engineering, Excel, Grades 6-8, HackingSTEM Microsoft, hydrology, Lesson Plan, Pollution, sensors, water quality