Pedal Power
Lesson courtesy of SciGirls Connect. See .pdf in English.
Grade level: 3 -8
Time: 2 hours
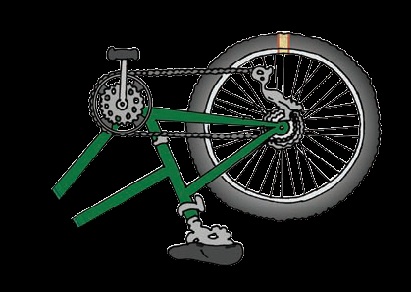
Summary
In this activity, small groups of students in grades 3 to 8 learn about forces, energy, and efficiency by measuring a bicycle’s gear ratios, calculating tire revolutions, and testing who can ride a course the swiftest based on that information.
Engineering connection/motivation
Biking is fun for all ages but pedaling can be tough unless you’re in the right gear. A bike’s gear system is designed to make pedaling more efficient on different terrains. The gear ratio measures how many times the back wheel turns for each rotation of the pedals.
Next Generation Science Standards
Engineering Design
criteria for success and constraints on materials, time, or cost.
3-5-ETS1-2. Generate and compare multiple possible solutions to a problem based on how well each is likely to meet the criteria and constraints of the problem.
3-5-ETS1-3. Plan and carry out fair tests in which variable are controlled and failure points are considered to identify aspects of a model or prototype that can be improved.
MS-ETS1-1. Define the criteria and constrains of a design problem with sufficient precision to ensure a successful solution, taking into account relevant scientific principles and potential impacts on people and the natural environment that may limit possible solutions.
MS-ETS1-2. Evaluate competing design solutions using a systematic process to determine how well they meet the criteria and constraints of the problem.
MS-ETS1-3. Analyze data from tests to determine similarities and differences among several design solutions to identify the best characteristics of each that can be combined into a new solution to better meet the criteria for success.
MS-ETS1-4. Develop a model to generate data for iterative testing and modification of a proposed object, tool, or process such that an optimal design can be achieved.
Physical Science
MS-PS2-2. Plan an investigation to provide evidence that the change in an object’s motion depends on the sum of the forces on the object and the mass of the object.
MS-PS3-1. Construct and interpret graphical displays of data to describe the relationships of kinetic energy to the mass of an object and to the speed of an object.
MS-PS3-2. Develop a model to describe that when the arrangement of object interacting at a distance changes, different amounts of potential energy are stored in the system.
MS-P3-5. Construct, use, and present arguments to support the claim that when the kinetic energy of an object changes energy is transferred to or from the object.
Common Core State Mathematics Standards
7.EE.B.3 Solve real-life and mathematical problems posed with positive and negative rational numbers, in any form, using tools strategically. Apply properties of operations to calculate with numbers in any form; convert between forms as appropriate; and assess the reasonableness of answers using computation and estimation strategies.
Common Core State Literacy Standards
Speaking and Listening
L.5.1 Engage effectively in a range of collaborative discussions with diverse partners on grade 5 topics and texts, building on others’ ideas and expressing their own clearly.
SL.5.3 Summarize the points a speaker makes and explain how each claim is supported by reasons and evidence.
SL.5.4 Report on a topic or text or present an opinion, sequencing ideas logically and using appropriate facts and relevant, descriptive details to support main ideas or themes; speak clearly at an understandable pace.
Writing
W.6.7 Conduct short research projects to answer a question (including a self-generated question), drawing on several sources and generating additional related, focused questions that allow for multiple avenues of exploration.
Standards for Technological Literacy
Grades 3-5
1.E Creative thinking and economic and cultural influences shape technological development.influences shape technological development.
2.K Tools and machines extend human capabilities, such as holding, lifting, fastening, separating, and computing.
3.C Various relationships exist between technology and other fields of study.
8.C The design process is a purposeful method of planning practical solutions to problems.
8.D Requirements for a design include such factors as the desired elements and features of a products or system or the limits that are placed on the design.
9.C The engineering design process involves defining a problem, generating ideas, selecting a solution, testing the solution(s), making the items, evaluating it, and presenting the results.
11.G Improve design solutions.
Grades 6-8
1.H Technology is closely linked to creativity, which has resulted in innovationcreativity, which has resulted in innovation.
2.M Technological systems include input, processes, output, and at times, feedback.
2.R Requirements are the parameters placed on the development of a product or system.
A product, system, or environment developed for one setting may be applied to another setting.
Knowledge gained from other fields of study has a direct effect of the development of technological products and systems.
8.E Design is a creative planning process that leads to useful products and systems.
8.G Requirements of a design are made up of criteria and constraints.
9.F Design involves a set of steps, which can be performed in different sequences and repeated as needed.
9.G Brainstorming is a group problem-solving design process in which each person in the group presents his or her ideas in an open forum.
10.G Invention is a process of turning ideas and imaginations into devices and systems. Innovation is the process of modifying an existing product of system to improve it.
11.L Make a product or system and document the solution.
Materials
For each small group:
- Bicycle with gears that can be changed
- Helmet
- Marker
- Pencil and paper
- Tape measure
- Stopwatch
- Chalk
- Calculator (optional)
Procedure
Beforehand, find a safe area where girls can ride their bikes. Determine the bike course; decide where to start and end. Try to include different features (e.g., flat surfaces, hills) and estimate the distance of the course.
1. Introduce bikes and gears. Divide girls into small groups1 and have them discuss how bikes work. Visit scigirlsconnect.org/page/pedalpower for background information, including embedded videos explaining bicycle mechanics, parts, and performance and an educational coloring book from the Society of Women Engineers.
2. Brainstorm. Ask each group to brainstorm ways to go faster on a bike (pedal quickly, change gears, bike design). Guide girls toward thinking about how gears affect speed.
3. Deliver the challenge: Determine which gears will help you bike a set course in the shortest amount of time.
4. Calculate gear ratio. Help each group turn their bicycle upside down on the floor. Make sure it’s stable. Use a marker to help count the teeth on the gears in the front (near the pedals) and in the back. Then, calculate each possible gear ratio. Rank them from highest to lowest and record data in a table. (Download an example table like the one below at scigirlsconnect.org)
|
Front Gear (F) |
Back Gear (B) |
Gear Ratio (F/B) |
Tire Revolutions
|
|
F1 (smallest gear) 28 |
B1 (smallest gear) = 14 |
2 |
|
|
B2 = 16 |
1.8 |
||
|
B3 = 18 |
1.6 |
||
|
B4 = 21 |
1.3 |
||
|
B5 = 24 |
1.2 |
||
|
B6 (largest gear) = 28 |
1 |
||
|
F2 (middle gear) 38 |
B1 (smallest gear) = 14 |
2.7 |
|
|
B2 = 16 |
2.4 |
||
|
B3 = 18 |
2.1 |
||
|
B4 = 21 |
1.8 |
||
|
B5 = 24 |
1.6 |
||
|
B6 (largest gear) = 28 |
1.4 |
||
|
F3 (largest gear) 48 |
B1 (smallest gear) = 14 |
3.4 |
|
|
B2 = 16 |
3 |
||
|
B3 = 18 |
2.7 |
||
|
B4 = 21 |
2.3 |
||
|
B5 = 24 |
2 |
||
|
B6 (largest gear) = 28 |
1.7 |
GEAR RATIO = number of teeth on front gear/number of teeth on back gear
 5. Calculate tire revolutions. Set the bike to its lowest gear (smallest gear in thee front, largest gear in the back). Mark a line on the back tire with chalk. Start with the pedal and tire marking at the 12 o’clock position as shown in the illustration (right). Slowly move the pedal forward, clockwise, and make one full revolution. Count how many revolutions the back tire makes.
Record this number and compare it to the gear ratio. Try the highest gear (largest gear in front, smallest gear in back). What is the relationship between gear ratio and tire revolution? (Low gears have more tire revolutions, high gears have fewer tire revolutions.) How do tire revolutions relate to speed? (The more tire revolutions per pedal stroke, the faster you will go.) Would you want to be in a high or low gear when you go up a hill? Down a hill? Why?
6. Plan and test. Show the girls the course and give groups 10 minutes to decide the gears to test and who will ride. Encourage them to think about which gears will work best on the various landscapes (low gears for uphill, high
gears for downhill, middle to high gears for flat stretches). Then, have groups take turns riding and recording their completion times. Each girl’s ability will be different, so they should each ride the course several times.
7. Share results. Have each group discuss what gears they used, why they used them and their various completion times. Are gears the only factor in speed? Ask girls to share other ideas for how to ride faster.
Troubleshooting tips
- If you only have one bike for the whole group, first calculate the gear ratio as a large group. Then, have small groups make plans for the bike course and present them. Choose two or three plans to test and discuss results.
- If there are girls in your group that can’t ride bikes, assign them to be recorders.
Additional Resources
The Bicycle as a System. AAAS Science NetLinks lesson on how bicycles work.
The Science of Cycling. The San Francisco Exploratorium’s illustrated primer on bike parts from frames to gears to materials.
21st Century Bike: The Loopwheel. CNN video introduces a new bike design that has wheels with springs instead of spokes.
Engineers Push the Limit to Design the World’s Fastest Bike. Inside Science article (Sept. 15, 2017) about the World Human-Powered Speed Contest and efforts by University of Toronto engineering students to build the world’s fastest bike. On this YouTube video, University of Toronto AeroVelo team member Victor Ragusila explains the physics and engineering that makes their bike so much swifter than a Tour de France racer.
Filed under: Class Activities, Grades 6-8, Grades 6-8, Grades K-5, Grades K-5
Tags: bicycle, biking, Class Activities, Energy, Engineering, forces, gear, Grades 6-8, Grades K-5, Lesson Plans, motion, pedaling, Physics, SciGirls, simple machines, Videos, Web Resources


