eGFI - Dream Up the Future Sign-up for The Newsletter  For Teachers Online Store Contact us Search
Read the Magazine
What's New?
Explore eGFI
Engineer your Path About eGFI
Autodesk - Change Your World
Overview E-tube Trailblazers Student Blog
  • Tag Cloud

  • What’s New?

  • Pages

  • RSS RSS

  • RSS Comments

  • Archives

  • Meta

NSTA Exploravision Contest 2017


ExploraVision is a K-12 STEM competition that focuses on what it takes to bring ideas to reality. Working with a teacher, teams of up to 4 students pick a current technology, research it, envision what it might look like in 20 years, and describe the development steps, pros and cons, and obstacles. Here are some sample projects.

Sponsored by the National Science Teachers Association and Toshiba, this year’s contest is linked to the Next Generation Science Standards. More than 350,000 students in the United States and Canada have participated in ExploraVision since its 1992 debut.

Students can win up to $10,000 in U.S. savings bonds. Past winners have envisioned technologies ranging from a retinal lens to counter the cloudy vision of people with macular degeneration to a hand-held food-allergen detector. To celebrate the contest’s 25th year, the top 25 teachers who submit the most projects  can win technology.

The competition is open to students enrolled in public and private schools or home educated in the United States and Canada. See the full eligibility requirements here.

Projects must be received at Toshiba/NSTA ExploraVision, online or by mail at 1840 Wilson Boulevard, Arlington, VA 22201-3000 by 11:59 pm EST, Monday, February 6, 2017.

An Engineer & Slam Poet


What do spoken-word poetry, engineering, and video contests have in common?

Plenty if you’re Nehemiah J. Mabry, a structural engineer, educator, and entrepreneur from North Carolina who took home this year’s grand prize in the National Academy of Engineering’s Engineering for You (E4U) video contest with an on-screen recitation of his slam poem, “Future Cities with Intelligent Infrastructure.”

Wouldn’t it be cool if our buildings and bridges/Had nervous systems like we do? the poem asks, launching into a riff about sensors that can monitor the health of structures and help prevent disaster.

“I’ve always had eclectic interests,” says Mabry, explaining how a lifelong Southerner who holds a Ph.D. in structural engineering and mechanics from North Carolina State University; a B.S. and M.S. in civil engineering from University of Alabama, Huntsville; and a B.S. in applied mathematics from Oakwood University in Huntsville is an equally accomplished performer and multimedia producer.

All through his schooling, Mabry never wavered from his ambition to be an engineer. At the same time, however, he nurtured his love for performing by singing in choirs, playing bass guitar, and directing improv and drama groups. He’s also been a slam poet since middle school.

“I decided to try as best as possible to blend my two worlds, because for me, I always looked at engineering through a lens of creativity and art, and vice-versa.” Mabry wants to use this creativity to connect with students, encouraging them—especially women and underrepresented minorities—not to give up on the subject.

mabryMabry drew national attention for his video for the “Engineering: Stay With It,” campaign in 2012 that Intel, MTV, Facebook, and Google kicked off in 2012  to combat high attrition rates. His multimedia company, STEMedia, produces podcasts for the National Association of Black Engineers, among other groups, as well as K-12 STEM workshops and STEM poetry competitions held at NC State in partnership with NSBE and the university’s Minority Engineering Programs Office. Mabry continues to write and perform poetry that contains mathematical and engineering wordplay throughout, combining technical know-how with emotional appeals to tired students.

“We’re building an audience…and it’s starting to get a little more notice now,” says Mabry, who works full time as a bridge design engineers at Simpson Engineers and Associates in Cary, N.C. NAE’s $25,000 grand prize and additional $5,000 “people’s choice” winnings will go to the company.

Mabry plans to continue highlighting sensors, infrastructure, and engineering on YouTube and social media in hopes of grabbing the fleeting interest of young people. His website quotes some staggering statistics: “six out of the top 10 influencers for 13-18 year-olds are YouTube stars.” With that kind of influence, perhaps Mabry is onto something.

This blog post was adapted from Sensor Sensation, a profile of Nehemiah J. Mabry that appeared in the November 2016 issue of ASEE’s Prism magazine. Read the full article by Prism associate editor Jenn Pocock HERE.

Visualize STEM

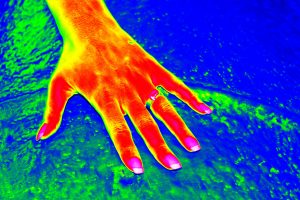
water showing warm hand skin temperature

Lesson and related activity courtesy of TeachEngineering.org, an online library of teacher-tested, standards-based STEM lessons. Contributed by Georgia Tech’s Partnerships for Research, Innovation, and Multi-Scale Engineering.  

Summary

In this lesson, high school students learn the value of writing and art in science and engineering by designing visual diagrams to communicate the results of thermal conductivity (heat flow) experiments they have conducted to anyone with little background on the subject. The principles of visual design include contrast, alignment, repetition, and proximity; with elements including the use of lines, color, texture, shape, size, value and space.

Note: If students already have data available from other experiments, have them jump right into the diagram creation and critique portions of the activity.

Grade level: 9-12

Time: 3 hours (including 1 hour to conduct experiment and create diagram)

Engineering Connection

One important skill for scientists and engineers is to be able to clearly explain and demonstrate their findings. Everything from promotions to funding to submitting publications requires easy-to-follow explanations. While equations and writing are two main techniques, the visual arts – diagrams, 3-D models, animations, tables, and graphs – often can be more effective at describing phenomena quickly and effectively, particularly to a lay audience.

Learning Objectives

After this lesson, students should be able to:

  • Explain the connection between art and engineering.
  • Explain how research funding happens in the sciences and engineering.
  • Explain the importance of clear communication and how art can help accomplish this.
  • Describe images using art vocabulary.
  • Explain how thermal conductivity affects heat flow.
  • Design and perform an experiment.
  • Evaluate the accuracy of their data and determine how to improve it.
  • Construct a visual model to represent their data.
  • Control experiment variables in order to determine correlation.

Learning Standards

Next Generation Science Standards

  • Construct an oral and written argument or counter-arguments based on data and evidence.
  • Models, mechanisms, and explanations collectively serve as tools in the development of a scientific theory.

Common Core State Mathematics Standards

  • Reason quantitatively and use units to solve problems.
  • Use units as a way to understand problems and to guide the solution of multi-step problems; choose and interpret units consistently in formulas; choose and interpret the scale and the origin in graphs and data displays.
  • Define appropriate quantities for the purpose of descriptive modeling.
  • Choose a level of accuracy appropriate to limitations on measurement when reporting quantities.

International Technology and Engineering Educators Association

  • Established design principles are used to evaluate existing designs, to collect data, and to guide the design process.
  • Engineering design is influenced by personal characteristics, such as creativity, resourcefulness, and the ability to visualize and think abstractly.
  • The process of engineering design takes into account a number of factors.

Introduction/Motivation

Be ready to show the class the nine-slide Using Visual Art to Communicate Presentation. This PowerPoint® file provides example images to get students thinking about how images can show action.

In advance, review the Teacher’s Slide Guide [PDF] for descriptions of each slide, suggested questions to ask, and possible answers. Also make copies of the Principles and Elements of Design Handout, one per student, which is also provided as the last two slides.)

How many of you have had to draw an image of something happening? Have you ever looked at a picture and been able to tell what was going on at the time even though the image is just a still frame? Do you think being able to make images like this may be useful to us in science and engineering?

Engineers use art regularly to explain their ideas and findings to others. The way engineers get funding for their research is often through grants, and the people deciding who gets the grant money rarely have in-depth background knowledge of the engineering topic. For example, if your proposed research or project has never been done before, you may be the only one in the world who even knows about it! Thus, it is important that you are able to communicate your ideas to your audience and art is a fantastic way to do that. It is so useful, in fact, that many engineering colleges offer drawing classes and CAD (computer aided design) courses so that students can become prepared and skilled to visually present ideas and concepts in the form of diagrams, schematics and prototypes.

Next, pass out the design handout and show the class the PowerPoint® slides. The handout provides fundamental art vocabulary and examples of methods used in art. Encourage students to use the correct terms to describe images in the presentation. At each slide, give students two or three minutes to answer the questions and as they are working, ask your own to prompt them to think of new ideas. After each image, have students share their findings and what they saw. As a recap on slide 7, explain the importance of each image and how each might be used in illustrating scientific and engineering work. Note that the slides are “animated,” so each click [mouse or keyboard] brings up the next image, text or slide.)

Continue on to provide students with the content in the Lesson Background section (scroll about one-third of the way down the page), which covers the research funding process, the principles and elements of visual design [slides 8 and 9] and visualizing heat flow including the real-world example of a heat sink, which prepares them to conduct the associated activity.

Visualizing Heat Flow

(Heat flow is an easy topic for which students can design experiments and then use art to communicate the data results. Students need not know specific background mathematics to start the associated activity experimental lab, but conclude at the end with the equation of heat flow so they can see the connection between their data and the math. The lab is designed to be open inquiry, but it can be made more structured if students need more guidance.)

Thermal control is a vital topic in science and engineering. Humans can only survive in narrow temperature ranges, food cannot grow in certain temperatures, our mechanical and electrical equipment do not function if it is too hot or too cold, and many more challenges occur if we do not control heat flow. One common application of controlling heat flow is the use of heat sinks in electronics.VISUALIZE Heat sink gat_visual_art_lesson01_figure1web
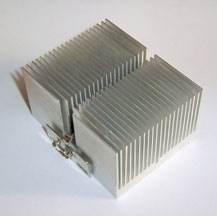
As they perform their tasks, computer chips generate a large amount of heat. If they are not kept cool, they overheat and sometimes melt. To prevent this, engineers use heat sinks (see Figures 1 and 2) to give off excess heat to the air faster than would usually happen. These heat sinks have very high rates of heat flow and so give off heat before it can build up on the chip.

Here is how it works. Heat flow can be modeled by the equation ΔQ/Δt = (-kAΔT)/x, where ΔQ/ Δt is the rate of heat flow in joules per second, k is the thermal conductivity of the material, A is the surface area of contact between two surfaces, ΔT is the difference in temperature between two objects, and x is the thickness of your material. If you want heat to flow out of your system faster, either increase k by changing the materials, increase surface area between two objects (A) or increase the difference in temperature between the objects (ΔT). If you want to slow it down, just make the material thicker (increase x).
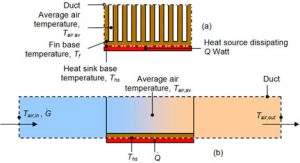
VISUALIZE gat_visual_art_lesson01_figure2webIn Figure 2, the chip is generating the heat. The thermal interface material has a high k value, typically ~200 W/(m*K) (watts per meter Kelvin), and it increases the surface area between the chip and the chip cap. The chip cap is thicker and builds up most of the heat, increasing ΔT, and increasing the surface area to the cooling medium, usually air.


Associated Activities

  • Heat Flow and Diagrams Lab – Students use the engineering design process to perform and refine an experiment that measures the thermal conductivity of different materials. After data are collected, students apply their new awareness of the principles and elements of art to create visual representations of their findings and present them to the class.

Lesson Closure

After the associated activity is completed and students have made diagrams, show them the mathematical equation ΔQ/Δt = (-kAΔT)/x and explain the variables they measured and what variables matter to heat flow. If this is being used as an introductory lesson, help students realize that equations are also another method for describing data. The equation is just another way to describe what has been observed with heat flow.

To end the lesson, discuss the desired format for writing in the classroom and give examples of how to write equations in papers and how to include and reference diagrams. At this point, expect students to feel comfortable creating write-ups of the associated activity’s lab that they just performed that would be clear to the average reader. As always, remind them to write as if the reader has never heard of the experiment, not to the teacher.

Attachments

Assessment

Pre-Lesson Assessment

Discussion Questions: Before showing the class the introductory Using Visual Art to Communicate Presentation, discuss the lesson topics, which are woven into the following questions. Listen to students’ answers and comments to determine their current thinking and familiarity with the concepts as well as to foreshadow the lesson topics.

  • How can we show motion in images?
  • Can art give us information?
  • How do you communicate with art?
  • Where do you use art to get information in your daily life?
  • What are some words we can use to describe art?
  • How might scientists and engineers use art to communicate ideas and information?

Lesson Summary Assessment

Evaluation of Lab Data: After completing the associated activity lab, have students discuss their findings and draw conclusions based on their data. Get students to think about ways to model their data, how to test other variables and other ways to design their own experiments. For AP students, have them write short responses to their labs similar to the paragraph-length free response to questions approach. Example questions include:

  • What do you think affected your variables?
  • How do different materials transfer heat differently? How do we account for that in the heat flow rate math equation?
  • How would you test thickness? Temperature difference? Explain your setup.
  • How could you do a mathematical model for your data?

Homework

Lab Write-Up: Students practice the writing skills discussed by creating lab write-ups that include diagrams using the “diagram design requirements” method that the class agreed to be the best (during the associated activity’s Procedure section). Grade their lab write-ups based on writing clarity, formatting, logic and organization/neatness, as well as the effectiveness of all visual presentation elements.

Additional Multimedia Support

A website that focuses on arts integration research, Harvard Graduate School of Education’s Project Zero: http://www.pz.harvard.edu/

Thermal Conduction. Khan Academy video explains the basics of heat transfer. [YouTube 7:15]

References

Archibald, Jeff. Principles of Design Quick Reference Poster. October 15, 2012. Free Friday Wallpaper, Paper Leaf Design. Accessed June 17, 2015. http://paper-leaf.com/blog/2012/10/principles-of-design-quick-reference-poster/
Archibald, Jeff. Elements of Design Quick Reference Sheet. February 7, 2011. Free Friday Wallpaper, Paper Leaf Design. http://paper-leaf.com/blog/2011/02/elements-of-design-quick-reference-sheet/

Contributors

Andrew Carnes, Satish Kumar, Jamila Cola, Baratunde Cola, ARTSNow, PRIME 2014 Fellows

© 2015 by Regents of the University of Colorado; original © 2014 Georgia Institute of Technology

Acknowledgements

This activity was developed by the Partnerships for Research, Innovation and Multi-Scale Engineering (PRIME) Research Experience for Teachers (RET) Program at Georgia Institute of Technology, funded by National Science Foundation RET grant no. EEC 140718.

Best STEM Books of 2017

pam lottero perdue

Looking for inspiring books about STEM that not only are good reading and build literacy skills but accurately depict complex content?

Responding to continued calls from teachers for just such a “best books” list, the National Science Teachers Association invited a unique collaboration with three other groups to help set the standard: the American Society for Engineering Educators (ASEE), the International Technology and Engineering Educators Association (ITEEA), and the mathematics representatives from the Society of Elementary Presidential Awardees (SEPA).

After nearly a year of study, the group released the first annual list of best STEM literature for young readers. Read the selection criteria HERE.diana ibarra

The 31-book roster includes biographies of historic figures, such as computer pioneer Ada Lovelace and polymath Ben Franklin, as well as high school inventors like Intel Science & Engineering Fair grand champion Jack Andraka, who developed an inexpensive early-detection test for pancreatic cancer. Subjects range from computers and genetic engineering to the SuperSoaker and Slinky.

ASEE was represented by Pamela S. Lottero-Perdue, chair of the Pre-College Engineering Education Division (photo, above) and Diana Lynne Ibarra, manager of the ShuYuan Science Programs in Hong Kong (photo, right). Each spent over 100 hours reading books for this project. Lottero-Perdue, an associate professor and director of the Integrated STEM Instructional Leadership Post Baccalaurate Certificate Program at Towson University in Maryland, was featured in a 2012 ASEE Prism cover story about the new face of engineering outreach to K-12 schools.

Happy reading!

NASA Space Spinoff Contest

Optimus Prime Spinoff and Research Challenge

Who: Students in grades 3-12

What: NASA contest

Submissions due: Feb. 10, 2017

Look around. Can you spot any everyday items came from space?

That question lies at the heart of NASA’s Optimus Prime Spinoff and Research Challenge, a contest that asks students in grades 3 to 12 to identify and dream up a new purpose for technology first developed for a space mission.

Once kids start looking, they’ll be amazed at how many products started sprang from NASA’s research. The list includes memory foam, invisible braces, firefighting equipment, artificial limbs, scratch-resistant lenses, aircraft anti-icing systems, shoe insoles, water filters/purification, cochlear implants, satellite TV, long-distance telecommunications… and Transformers! Check out NASA’s spinoff YouTube channel detailing some of the agency’s technologies now in commercial use.

Challenges are tailored for the elementary (3-5), middle (6-8), and high (9-12) school age groups.

Elementary students will test their skills by changing an everyday object into something that will make the world a better place. Middle school students will expand their understanding of NASA Spinoff technology by developing their own Spinoff ideas. And high school students will work with college mentors and focus on the James Webb Space Telescope technology for their Spinoff ideas, creating models and visual representations within a 3-D, multi-user virtual world environment.

To display their research and ideas for innovations, students will use a combination of text, images, and videos to create a Glogster Multimedia Poster.  This poster will be submitted and the student ideas will be shared with NASA.

Past winners have included middle school girls who designed a compact tent that uses phase-change material to shelter refugees and homeless people.

For each challenge:

  • Ten Glogster Digital Design posters will be selected for nationwide voting to determine the public’s favorite poster!
  • ONE winning elementary and middle school Glog will be selected by NASA personnel using rubrics provided at the OPSPARC website.

For the high school challenge:

20 teams will be selected for the InWorld OPSPARC experience, where they will work with a college engineering and/or entrepreneur mentor and interact with NASA scientists in a 3-D multi-user virtual world to develop their design!

Click HERE to see last year’s winning submissions.

Click HERE for scoring rubrics, downloadable flyer, letter to parents, and other forms.

For full competition details for the 2017 NASA OPSPARC Challenge, please visit: https://nasaopsparc.com/.

U.S. Students Lag in STEM

math worksheet

Despite years of White House science fairs, a national emphasis on STEM education, and new science standards that include engineering design, U.S. students still fall short of their peers around the world in math and science, a major international exam reveals.

The 2015 Trends in International Mathematics and Science Study, or TIMSS, found that American eighth graders performed slightly better than four years ago, but fourth graders saw scores dip slightly. While both groups have seen science and math scores rise since the test first was administered in 1995, U.S. still lag their Asian counterparts.

Nearly 600,000 students in dozens of school system worldwide took the 2015 TIMSS. The average math score for American fourth graders trailed that of students in 10 other countries: Singapore, Hong Kong, South Korea, Taiwan, Japan, Russia, Northern Ireland and Ireland, Norway, and the Flemish portion of Belgium. In Singapore, half the students scored at the advanced level, compared with just 14 percent of U.S. students.

Eight systems, including those in Great Britain, Kazakhstan, Portugal, Denmark, Quebec, Lithuania, Finland, and Poland had average math scores that were not measurably different from the U.S. average.

“Certainly we have much more work to do and achievement is not as high as we would like to have it,” Matt Larson, president of the National Council of Teachers of Mathematics, was quoted in the Washington Post. “But the trajectory is positive, and it may indicate that some of the efforts we’ve made over the past two and a half decades are making a difference.”

David Evans, executive director of the National Science Teachers Association, noted that the amount of time devoted to science has decreased as schools focused on raising standardized test scores in reading and math. He’s hopeful that the Next Generation Science Standards, which require students to learn science by doing it and  have been adopted by 18 states — including California and Illinois — will propel bigger gains in the coming years.

“I think we’re right now at the very beginning of what could be a very significant change in the way we teach science,” Evans said.

Results in the TIMSS Advanced, which measures the performance of high school seniors who take advanced courses in physics and math, held steady from 1995, but revealed a yawning gender gap. Males scored 46 points higher than females in physics, and 30 points higher in math.

Soil Whisperer


From the air or highway, America’s fruited plains present a uniform vista of vast abundance. Not to Amy Kaleita. The associate professor of agricultural and biosystems engineering at Iowa State University sees a “nonlinear, somewhat chaotic” array of micro-plots, each with unique hydrology, root depths, soil characteristics – and ripe opportunities for smart technology to enhance both sustainability and food production.

“Precision conservation,” Kaleita’s research field, piggybacks on the precision farming that GPS-equipped combines launched in the 1990s. Beyond optimizing crop yields, she seeks to “maximize the agricultural impact by treating the soil differently,” applying data on erosion, fertilizer runoff, and other environmental factors to better manage land.

In her dream scenario, outlined in a 2013 Gilbreth Lecture at the National Academy of Engineering, temperature and water sensors in the soil would help customize seed depth; aerial drones and satellite imagery would monitor growth; and future plantings would be adjusted to cut chemical use. Faster, cheaper technologies – like tracking plant nutrients with a smartphone, a project of her Spatial Data Analysis Lab – can improve such time-tested techniques as crop rotation and pairing. The result: bigger harvests with a smaller environmental impact.amy kaleita in field

Kaleita didn’t grow up on a farm and hadn’t heard of agricultural engineering until arriving at Penn State University interested in biomedical engineering but finding no major. Attracted by the chance to take microbiology as an elective. she “got hooked on the idea that food and the environment are just as fundamental as health care. That satisfied my desire to contribute to society” and led to a Ph.D. from the University of Illinois.

Kaleita’s own “big learning curve” in agriculture helped her become an award-winning teacher of conservation engineering and soil and water conservation management, “because I know how hard it is to learn something so foreign.” For example, she developed a hands-on way for students to learn about the impact of rain and erosion on soil using an augmented reality sandbox – shown in this video.) In turn, her research – from climate change to assessment of agricultural engineering programs – benefits from her students’ fresh perspective. “There’s a highway of learning that runs both directions,” says Kaleita. And it runs through fertile engineering ground.

This profile originally ran in 20 Under 40, a special report on engineering education’s rising young stars that appeared in the September 2014 issue of ASEE’s Prism magazine.

Engineer Girl Essay Contest


Deadline: February 1, 2017 at 6 p.m. EST
Level: Boys and girls in grades 3-12

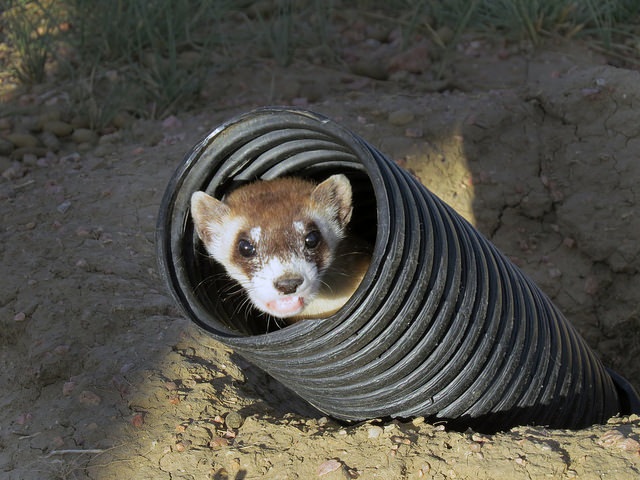
“Engineering and Animals” is the theme for the National Academy of Engineering’s 2017 EngineerGirl! Essay Contest. Students in grades 3 to 12 are asked to choose an animal that is ranked by the International Union for the Conservation of Nature as either vulnerable, endangered, or critically endangered – like the black footed ferret in the photo below – and consider how engineering might improve life for that species.

Prizes range from $100 to $500.

The contest is open to individual girls and boys in the following three competition categories :

  1. Elementary School Students (grades 3-5); Essays must be 400 to 700 words.
  2. Middle School Students in (grades 6-8); Essays must be 600 to 1,100 words.
  3. High School Students (grades 9-12); Essays must be 1,000 to 1,500 words.endangered black footed ferred

How to Enter

Write an essay which addresses the requirements in the contest description. Essays should be written clearly. They may be shorter than, but should not exceed, the word limit. Submit the essay through the Online Submission Form on the EngineerGirl! website, and include all required information.

Entries must be received by 6:00 p.m. (EST) on February 1, 2017. Click HERE for the contest rules.

What are the Awards?

All winning entries will be published on the EngineerGirl! website. (Please review the publication agreement before you submit your essay.) In addition, all winners will receive the prizes listed below:

  • First-place winners will be awarded $500.
  • Second-place entries will be awarded $250.
  • Third-place entries will be awarded $100.

Honorable Mention entries will not receive a cash reward but will be published on the EngineerGirl! website.

Additional Rules

  • Essays will be judged on the basis of design content, research, expression, and originality. You may wish to preview the 2013 Contest Scorecord.
  • All essays must be the original work of the author submitting the entry and must not have been published anywhere else.
  • A contestant may enter only one essay.
  • All entries will be read by a panel of judges, whose selections will be final.

For more information and to apply, click here.

Learn more about how engineers are rescuing the endangered Ganges River Dolphin in the April 2016 issues of IEEE Spectrum.

Soil Biosolarization: Sustainable Weed Killer


Adapted from TeachEngineering activity contributed by the GK-12 program, College of Engineering, University of California Davis. 

Summary

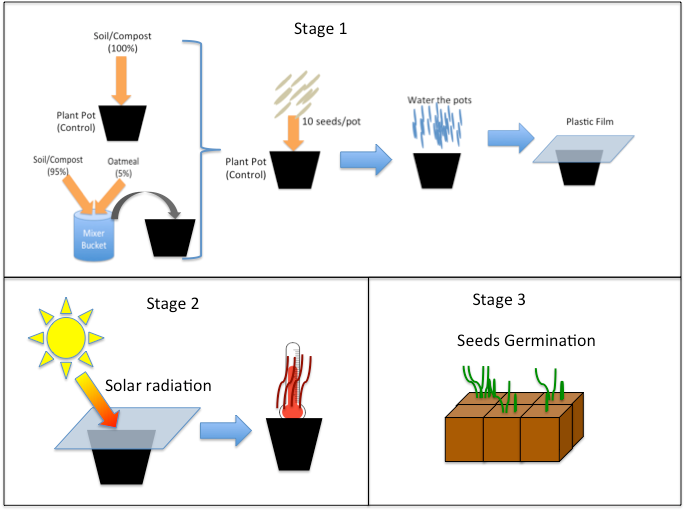
In this three-part activity, students in grades 5 to 7 act as agricultural engineers, learning about and testing the effectiveness of a sustainable pest-control technique called soil biosolarization that uses organic waste rather than of toxic compounds to help eliminate weeds. Teams prepare seed-starter pots using a source of microorganisms (soil or compost) and “organic waste” (such as oatmeal, a source of carbon for the microorganisms). They then plant “weed seeds” in the pots, counting any sprouts and assessing the efficacy of the technique to kill weeds.

Grade level: 5-7

Time: 170 minutes (An initial 90-minute session, one 30-minute session a day later, and one 50-minute session a week after the second session.)

Engineering Connection

Engineers apply science and math to create products and processes designed for the betterment of humankind and the environment. Microbial engineers use microorganisms to transform waste into something useful. Waste management engineers are responsible for reducing landfill and incinerator waste as well as transforming the waste into something useful. Agricultural engineers create ways that farmers can make and use compost to help plants grow better, less expensively, and without harming farm workers or the environment. The principles of soil biosolarization span each of these engineering specialties as organic waste is transformed to increase crop production and protect crops from pests.

Learning Objectives

After this activity, students should be able to:

  • Describe the importance of organic waste to composting.
  • Explain the importance of sustainable pest control techniques.
  • Conduct a scientific experiment to test the effectiveness of a soil biosolarization pest control method as a means of reducing the impact of humans on the environment.
  • Examine experimental results to assess how well the soil biosolarization system worked.

Academic Standards

Next Generation Science Standards

  • Obtain and combine information about ways individual communities use science ideas to protect the Earth’s resources and environment. (Grade 5)
  • Apply scientific principles to design a method for monitoring and minimizing a human impact on the environment. (Grades 6 – 8)
  • NGSS correlation with the California Education and the Environment Initiative (Grades 3 – 5)

International Technology and Engineering Educators Association: Technology

  • Students will develop an understanding of the relationships among technologies and the connections between technology and other fields of study. (Grades K – 12)
  • Students will develop abilities to assess the impact of products and systems. (Grades K – 12)

Pre-requiste Knowledge

Students should be:

  • Familiar with the concepts covered in the associated lesson, A Daily Dose of Sun Keeps the Pests Away: How Soil Solarization Works. Familiarity with the greenhouse effect is helpful, but not necessary.
  • Familiar with the scientific method and able to explain that experimental controls provide a means of comparing treated samples to non-treated samples in order to assess the effectiveness of a treatment.
  • Able to calculate averages and percentages to assess soil biosolarization efficacy.

Materials

Each group needs:

  • 6 pots or cups with drainage holes, such as seed-starting plastic pots
  • Container or tray to catch draining water from the seed starting pots
  • 60 seeds, such as lettuce or other plant that sprouts within a week
  • 1 graduated container, to measure the volume of the seed starting pots
  • Bucket for mixing soil and “organic waste,” big enough to hold enough soil and organic waste to fill 3 of the seed-starting pots
  • Thermometer
  • Soil Biolsolarization Activity Handout [PDF]
  • Pre-Activity Quiz and Post-Activity Quiz, one each per student

To share with the entire class:

  • Potting soil or compost, enough for each group to fill its 6 seed-starting pots
  • “Organic waste,” such as a solid food source that is easy to mix with soil, like oatmeal, flour, or cornstarch
  • Transparent plastic wrap
  • Water

Procedure

Background

Soil solarization is a sustainable, nonchemical pest-control method that eliminates soil-borne pests via the high temperatures produced when solar radiation reaches soil covered with a transparent plastic tarp. The process usually takes four to six weeks and is performed during the hottest period of the year. The plastic sheets trap the sun’s heat in the soil, taking advantage of the greenhouse effect. The process can kill a wide range of soil-borne pests, such as weeds, nematodes, and insects. In some cases, this heating is not enough to kill the soil-borne pests. The addition of organic waste soil can boost the soil microbial activity by adding two new effects to the process: 1) the metabolic energy of microbes degrading organic matter slightly increases the temperature during the process and 2) during the degradation of the organic matter, volatile fatty acids made by the microbes can reach levels that are toxic to soil-borne pathogens. This method is known as soil biosolarization.

soil_solarization_lesson01_activity1_image2

Image © 2016 Jesús D. Fernández Bayo

Before the Activity

Gather materials and make copies of the Soil Biosolarization Activity Handout, Pre-Activity Quiz and Post-Activity Quiz, one each per student.

Check the weather and consider conducting the activity outside if weather permits.

Administer the Pre-Activity Quiz, giving students enough time to answer the seven questions. Review their responses to determine which concepts need to be reinforced during the activity.

With the Students—Session 1: Experiment Setup

1. Present the Introduction/Motivation content to the class, highlighting the following main points:

    • The importance of organic waste and the role of microorganisms in transforming organic waste into compost
    • The terms “pest” and “pesticide”
    • The environmental and health problems associated with the use of pesticides
    • The importance of developing and using less harmful pest control methods
    • The (hypothetical) student role in the activity—acting as an agricultural engineer testing a method designed to eliminate weeds from soil
  1. Pass out the handout. Explain that the handout contains activity experiment instructions as well as questions and a data table for students to complete as their teams work through the activity. The activity is divided into three stages: experiment setup plus data gathering one day and one week later.
  2. Divide the class into engineering teams of four students each.
  3. Tell students that each member of the team is an agricultural engineer and that—while all team members are expected to participate in all components of the activity—each team member will be responsible for a specific task. For each engineering team, assign student roles. Reader: reads instructions. Writer: fills out the worksheet. Speaker: presents and explains results to the class. Organizer: leads the experimental setup.
  4. Tell students which materials they can use to prepare the “agricultural soil mix” and why they are important: Soil and/or compost provide the environment where the pests and microorganisms live.Organic waste (the oatmeal, flour, cornstarch or other food ingredient of your choice) is a source of easily degradable organic carbon to feed the microbes.
  5. Explain that each group will have two treatments: 1) control treatment, which is only soil, and 2) experimental treatment (soil and organic waste).
  6. Guide students to measure the volume of their seed-starting pots using a graduated container and potting soil. Prompt them to use this information to estimate the amount of organic waste they need to add (5% of the seed-starter pot volume) and record their findings on the handout.
  7. Have students fill three of their pots with soil only (the controls). Somehow (tape, sticks) identify these pots as the control pots for each team.
  8. To prepare the three treated soils, direct students to fill their mixer buckets with three times the amount of soil and organic waste estimated in step 7; then, close the mixer bucket and shake it to mix the soil and organic waste.
  9. After mixing, tell students to divide the mixture evenly and transfer it into the three treatment pots.
  10. Once each group has its six pots ready, direct them to plant 10 seeds in each pot. Explain that the seeds represent the weeds they are trying to eliminate.
  11. Have students water each of the six pots until water flows out of the bottom. (It is helpful to place a container or tray under the pots to minimize the mess.) Then cover each pot with plastic wrap.
  12. Place the pots in a sunny spot in the school and leave them for solarization for at least one day (no more than one week is recommended).With the Students—Session 2: Data Collection (after at least 1 day)
    1. Have students remove the plastic film from their pots, smell the control and treatment pots, and describe their smell observations in Table 1 on the handout.
    2. Hand out thermometers and guide students to measure and record soil temperatures.
    3. Have students calculate the mean temperature per treatment.
    4. Direct students to water the pots again. If possible, keep the pots in a humid place and/or cover them with a transparent box.
    5. Until the next session, have students keep the soil in the pots moist by watering every 2-3 days. This is especially important if the pots are not covered.

    With the Students—Session 3: Data Collection and Analysis (final session; 1 week after Session 2)

    1. One week later, have students count the number of plants in each pot and record their findings.
    2. Direct students to calculate the mean percentage of seed inactivation per treatment.
    3. Have each team present its results to the class and post the data on the classroom board for all to see.
    4. Engage the class in a discussion of the results and in determining conclusions. Expect the results to show more plants in the control pots than in the treated soils. Expect a higher percentage of seed inactivation in the soil amendment to be related to the smells perceived during session 2. This bad smell is attributed to the acids formed during the degradation of the organic matter and their accumulation to a toxic level due to the plastic preventing them from escaping.
    5. As a class, review the activity learning objectives.
    6. Administer the Post-Activity Quiz.

Safety Issues

  • Since students handle soil and compost,  advise them to use gloves or to wash their hands after the activity.
  • Verify that no students have allergies to the selected food waste.

Troubleshooting Tips

  • Prior to conducting the activity, plant some seeds in the substrate that the class will be using in order to confirm that the seeds are viable and will grow during the experiment.
  • If no plants emerge after one week, wait a bit longer to make sure they are watered sufficiently and in a humid place. If no plants emerge and the final session cannot be delayed any further, give students hypothetical counts for the number of emerged plants per pot; make these values show a higher number of plants (weeds) grown in the control pots than the treated pots.
  • Plant seeds in several extra pots, so that all teams can participate if a pot fails to sprout or accidentally spills.

Activity Scaling

  • For lower grades (3-4), skip or simplify the mathematical calculations. Also consider providing students with specific values of organic waste and soil, or calculate them as a class.
  • For higher grades (7-9), remove the equations and designs that clarify the calculations outlined on the student handout and have students independently determine the necessary calculations. Also consider diversifying the types and quantities of organic wastes added to the treatment pots.
  • For large classes in which more than four groups can be formed, consider having each group add a different amount of organic waste to the soil in the treatment pots. Then, as a class, compare results and discuss which amount was the most effective at eliminating “weeds.”
Resources
Andalusian Stories: Biosolarization – A new technique for strawberry cultivation. [YouTube 1:40]
Advances in Biosolarization Technology to Improve Soil Health and Organic Control of Soilborne Pests. Stapleton, et al. Proceedings of the Organic Agriculture Research Symposium, January 20, 2016.References

Gamliel, A., Stapleton, J.J. 1997. Improvement of Soil Solarization with Volatile Compounds Generated from Organic Amendments. Phytoparasitica, 25, S31-S38.

Katan, J., Greenberger, A., Alon, H., Grinstein, A. 1976. Solar Heating by Polyethylene Mulching for Control of Diseases Caused by Soil-Borne Pathogens. Phytopathology, 66(5), 683-688.

Contributors

Jesús D. Fernández Bayo

Copyright

© 2016 by Regents of the University of Colorado; original © 2016 University of California Davis