


Measuring Light Pollution
Activity courtesy of TeachEngineering, contributed by the AMPS GK-12 Program, Polytechnic Institute of New York University.
Grade Level: 6-7
Time: 45 minutes
Note: Requires the use of reusable LEGO MINDSTORMS NXT intelligent bricks and sensors;
Summary:
Students in grades 6-7 build light meters and investigate the nature, sources, and levels of light in their classroom environment. They learn about the adverse effects of artificial light on humans, animals, and plants as well as the engineering concepts of sensors and lumen and lux (lx) illuminance units. They also learn how to better use light and save energy as well as some of the technologies designed by engineers to reduce light pollution and energy waste.
Engineering Connection
Creating and controlling light is a great engineering achievement. Engineers develop artificial sources of light to satisfy specific requirements including good luminance, energy savings, and light fixture design that appropriately directs and reflects light, reduces light waste and minimizes light invasion. The modern complexity of light installation in buildings and outdoor venues requires the expertise of lighting/illumination engineers to design for specific needs and optimize power consumption. In this activity, the lux meter built and used by students is an example of a device that connects electrical engineering and computer science. The activity provides mathematics practice in recording, plotting, and analyzing data, mirroring how engineers collect and analyze data to solve real-world design challenges.
Learning Objectives
After doing this activity, students should be able to: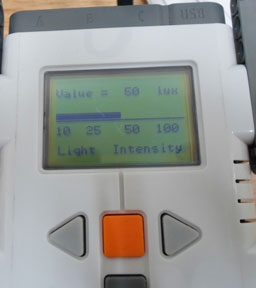
- Explain and identify light pollution and understand how engineers measure light intensity.
- Describe and list examples of adverse effects resulting from light pollution.
- Describe and list solutions proposed by engineers to address light pollution.
- Construct a light level meter to record light intensity in the classroom.
- Plot and analyze collected data.
Learning Standards
Next Generation Science Standards
Define the criteria and constraints of a design problem with sufficient precision to ensure a successful solution, taking into account relevant scientific principles and potential impacts on people and the natural environment that may limit possible solutions. [Grades 6 – 8]
Common Core State Mathematics Standards
- Represent and interpret data. [Grade 5]
- Display numerical data in plots on a number line, including dot plots, histograms, and box plots. [Grade 6]
- Summarize numerical data sets in relation to their context [Grade 6]
- Construct and interpret scatter plots for bivariate measurement data to investigate patterns of association between two quantities. Describe patterns such as clustering, outliers, positive or negative association, linear association, and nonlinear association. [Grade 8]
International Technology and Engineering Educators Association
- Students will develop an understanding of the relationships among technologies and the connections between technology and other fields of study. [Grades K – 12]
- Students will develop an understanding of the effects of technology on the environment. [Grades K – 12]
Materials List
Each group needs:
- LEGO MINDSTORMS NXT robot, such as the NXT Base Set (5003402) for $159.98 at LEGO Education.
- LEGO MINDSTORMS Education NXT Software 2.1, available as a single license (2000080) for $39.97 or a site license (5003413) for $271.96.
- computer, loaded with NXT 2.1 software and USB cable
- Measuring Light Pollution Pre-Activity Survey, one per student
- Measuring Light Pollution Worksheet, one per student (page 2 is blank graph paper)
Introduction/Motivation
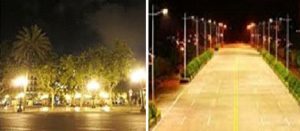
Examples of bad (left) and good (right) lighting orientation. Good lighting orientation reduces light pollution.
What is light pollution? Artificial light produced by incandescen
ce bulbs, fluorescent tubes and compact fluorescent lights has changed the world and enabled people to operate in the absence of sunlight, but light pollution is the side effect of the human-generated lighting created in industrial civilizations. The benefits of these artificial sources of lighting come with consequences such as poor lighting design that allows artificial light to shine outward and upward into the sky where it is not wanted, instead of directing it downward, where it is needed. In addition, the increased need for domestic and public lighting requires the burning of more fossil fuel, which generates other types of pollution such as carbon dioxide and greenhouse gas emissions. For that reason, energy waste is also considered part of light pollution.
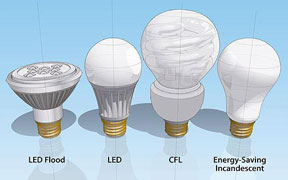
How does light pollution relate to engineering? Light pollution is a recognized concern in urban and suburban areas for many reasons, including the fact that it obscures our vision of the night sky. Light pollution negatively affects the astronomy, aerospace and astrophysics experiments conducted by scientists and engineers. To address light pollution, electrical engineers and lighting (illumination) engineers design efficient and intelligent light fixtures and systems that save energy and better direct light towards where it is needed. Intelligent lighting design and energy saving is now the standard objective in the industry fabrication of new lighting sources and systems. Civil engineers and architects include this approach in almost all new building designs. A compact fluorescent lamp (or light) (CFL) is one example of an efficient illumination product that engineers have designed. A CFL produces light with the same power as several bulbs combined together and uses less energy. Energy Star lighting fixtures, lanterns and spotlights make use of geometry and optical design to optimize light directing and reduce the number of bulbs needed. Advances in light-emitting diode (LED) technology enable it to be used as an energy-saving source of domestic, vehicle and commercial lighting. Computerized lighting systems are programmed to continually sense and adjust the amount of artificial light provided depending on the varying amount of natural light present.
Vocabulary/Definitions
- candela (cd): The SI (International System of Units) unit of luminous intensity.
- energy waste: Inappropriate and/or inefficient use of artificial light or energy-using appliances.
- environment: The air, water and land in or on which people, animals and plants live.
- glare: Light shining brightly into people’s eyes.
- light meter: A device that measures the visible light intensity.
- light pollution: Misdirected and/or misused artificial light.
- light trespass: When artificial light is directed towards someone else’s property that is not intended to be lighted.
- lumen (lm): A measure of light perceived by the human eye.
- lux (lx): A unit of illumination equal to 1 lumen per square meter.
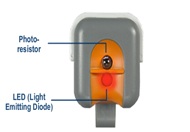
- photo resistor: A light sensor.
- photometry: The science of measurement of light’s brightness.
- pollution: Unwanted and undesirable contaminants in the natural environment.
- sensor: A device that converts a physical quantity into an electrical signal.
- sky glow: The resulting sky illumination when artificial light wastefully escapes into the night sky.
- watt (W): A measure of electrical power.
Procedure
Background
In this activity, students build light meters using LEGO MINDSTORMS NXT intelligent bricks and light sensors and then measure light intensity in the classroom. A light sensor converts a physical quantity into an electric signal that can be read and interpreted by the LEGO intelligent bricks and a software program is used to display the light intensity. Students measure the intensity of light in their classroom and see why it is important to turn off the lights on a sunny day or when on no one is using the room. Students are introduced to some vocabulary words used in photometry, which is the science of measurement of light’s brightness. Students also learn about sensors that convert physical quantities to electrical signals and they are introduced to computer science through the software that operates the light meter.
Before the Activity
- Gather materials and make copies of the Measuring Light Pollution Pre-Activity Survey and Measuring Light Pollution Worksheet. As necessary, modify the worksheet in accordance with your classroom lighting situation (or use other lighting sources) with the idea to create at least four types of classroom lighting conditions that will generate data showing an increasing light intensity.
- Set the system in place by making sure all the components are connected to the appropriate ports (touch sensor to port 1, light sensor to port 3) of the LEGO NXT intelligent brick.
- Check to make sure the battery level is good.
- Calibrate the light sensor: In a dark room, follow these three steps:
- Run the program lightMeter.rbt.
- Press the button attached to the touch sensor to start recording data (the light level).
- The screen must display zero lux.
Note: The NXT light sensor can measure light intensity on a scale from 0 to 100; 0 is the weakest intensity and corresponds to the total absence of light, while 100 is the strongest intensity. The light-intensity under a desk measures approximately 20, while the light-intensity of a fluorescent light is approximately 85. The noon sunlight must be at 100, the maximum value.
With the Students: Measuring light level
- Before doing anything else, administer the pre-activity survey.
- Present to students the Introduction/Motivation material.
- Divide the class into groups of three students each.
- Hand out the worksheets. Have students answer questions 1 and 2 on the worksheets before mounting the light sensors and operating the light meter.
- Give the groups all the necessary materials and have them repeat steps 2 and 3 of the “Before the Activity” steps.
- Open the lightMeter.rbt program on your computer (if for any reason the sensor ports are changed, please do so in the program).
- Connect the USB cable and upload the program onto the LEGO brick.
- Run the program on the LEGO brick by selecting the correct program and pressing the orange button twice.
- Start recording the light intensity by pressing the touch button.
- Note that while the program executes, the amplitude of the measured light is instantaneously displayed and also saved to a file.
- When the program ends, students compare their results with the average standards on the same type of light.
- The lux meter measurements may differ from the values printed on the bulbs or fluorescent tubes. Engineers attribute any differences to variables such as the distance from the lighting source, the angle of inclination of the light sensor from the lighting source, the current intensity powering the lighting source and the ambient conditions, such as the presence or absence of sunlight. Inform students that professional measurement instruments are very expensive and operated by highly trained engineers or technicians in well-defined conditions. Thus, some error is anticipated in this activity due to using less precise measuring devices in an environment that is more difficult to control with students learning to use instruments.
- Students plot their data as line charts using graph paper and an appropriate scale.
- Students analyze the data based on the plot and answer the worksheet questions. Hand in the worksheets for grading.
- Through a class discussion, have students share results and draw conclusions about the patterns observed in their data and graph. Also recap the types of light pollution and the technologies developed by engineers to reduce light pollution and be more efficient with energy usage. Ask students to describe what they could take to reduce light pollution at school and at home. See additional questions in the Assessment section.
AttachmentsTroubleshooting Tips
Make sure the equipment is set up correctly, the battery levels are good and sensors are connected to the correct brick ports.
Make sure the lightMeter.rbt is running.
Always calibrate the sensor before gathering data.
Refer to the NXT website for any other issues
Assessment
Pre-Activity Assessment
Pre-Activity Survey: Before providing any information, ask students to complete the Measuring Light Pollution Pre-Activity Survey to the best of their abilities. Reassure students that this is not for a grade so they feel comfortable writing down their ideas, even if they are unsure. Tell them that even if they do not know all the answers at the start of class, they will know them by the end of the activity. Review students’ answers to gauge their baseline understanding of the subject matter.
Informal Discussion: Ask students some questions about the subject matter, covering the questions and correct answers to the pre-activity survey. Refer to the Measuring Light Pollution Pre-Activity Survey Answers and Vocabulary/Definitions section. Ask the students:
- What is pollution? Have you ever heard about light pollution? What is light pollution?
- What tools might we used to measure visible light intensity?
- What unit of measure do we use to measure light level?
Activity Embedded Assessment
Analysis: While the experiments are being conducted, have students complete the Measuring Light Pollution Worksheet by recording data, answering questions and drawing line graphs. Ask students to comment on the procedure to measure the light intensity during each experiment trial. To make sure the graph is completed correctly, ask students what they must display on the horizontal axis and what they must display on the vertical axis. Check that students use an appropriate scale that can fit all the collected data. Review students’ worksheet answers, data and graphs to gauge their comprehension.
Post-Activity Assessment
Formal Discussion: To gauge student comprehension, ask them to explain the entire procedure in their own words, as if they were explaining the activity to a family member. Ask the students:
- Explain light pollution, its various types, the unit used to measure light intensity, and the measurement tools used to measure light levels. Expect students to be able to cite at least two types of light pollution (sky glow, glare, light trespass, energy waste: light in an unoccupied room), two side effects of light pollution (altering night sky viewing in big cities, cancer, light invasion, altering animal reproduction and behavior) and two manufactured products that reduce light pollution (light fixtures, energy-efficient bulbs such as CFLs and LEDs).
- What are the roles of each experiment component (the light sensor, brick, program and graph)? Expect students to explain that the light sensor captures the light intensity and transforms it into an electric signals that are analyzes and transformed into numerical value by the brick (the computer/brain). The program contains the set of instructions to tell the brick how to capture, analyze, store and display the light intensity. The graph is a visual representation of the data and helps us to understand the data by seeing any patterns, similar to what engineers do every day.
References
Bullough, John D. Energy-Efficient Street Lighting in New York State. 2002. NYSERDA: New York State Energy Research and Development Authority. Accessed May 28, 2013.
Hölker, Franz, C. Wolter, E. K. Perkin, and K. Tockner. 2010. “Light pollution as a biodiversity threat.” Trends in Ecology and Evolution. 25: pp. 681-682. Accessed May 28, 2013. http://nbcgib.uesc.br/ckfinder/userfiles/files/texto%20prova%20ingles.pdf
Hurley, Susan, David Nelson, Andrew Hertz and Peggy Reynolds. 2012. “P-188: Indoor and Outdoor Light Pollution and the Risk of Breast Cancer.” Epidemiology. Vol. 23, Issue 5S, September, pp. S-593.
Mizon, Bob. “Adverse Impacts of Inefficient Artificial Lighting.” Chapter 3 in Light Pollution. New York, NY: Springer Science+Business, 2012, pp. 53-75.
Pendoley, Kellie, Arwini Kahlon, Robert Ryan and Jeremy Savage. 2012. “A Novel Technique for Monitoring Light Pollution.” International Conference on Health, Safety and Environment in Oil and Gas Exploration and Production, Society of Petroleum Engineers. September 2012, Perth, Australia
Additional Resources
International Dark Sky Association. Site includes a blog and information for marking International Dark Sky Week in late April.
Carpe Noctem: Dark Sky Movement. eGFI Teachers’ feature on world’s first academic research center devoted to the impact of nocturnal light pollution includes links to resources to mark International Dark Sky Week.
On Light Pollution: The End of Darkness. New Yorker YouTube Channel video [5:35]
A World Without Light Pollution. YouTube video [1:35] showing cities with the Milky Way.
Contributors
Violet Mwaffo, Jerib Carson, and Qianqian Lin at the Madiba Prep Middle School
Copyright
© 2013 by Regents of the University of Colorado; original © 2012 Polytechnic Institute of New York University
Supporting Program
AMPS GK-12 Program, Polytechnic Institute of New York University
Acknowledgements
The development of this activity was supported by the Applying Mechatronics to Promote Science (AMPS) Program funded by National Science Foundation GK-12 grant no. 0741714. However, these contents do not necessarily represent the policies of the NSF and you should not assume endorsement by the federal government.
Photo credits: Cover image by Nate Pesce pictures Altramesia Grady, Energy and Electric Engineer with with Fort Meade, showing kids from Monarch Academy in Glen Burnie how a device measures light from LED and fluorescent lightbulbs during Earth Day celebration at the Fort Meade Pavilion, April 28, 2016. Light meter image copyright Violet Mwaffo, Polytechnic Institute of New York University. Light bulb graphic copyright the U.S. Department of Energy. LEGO meter copyright LEGO.
Filed under: Class Activities, Grades 6-8
Tags: Class Activities, Computer Science, data analysis, Electrical Engineering, Environmental Engineering, Environmental science, Grades 6-8, graphing, LEGO MINDSTROMS, Light pollution, lumens, lux, Mathematics, measuring, sensors