Activity: Eyewitness to Evaporation
 Lesson courtesy of TeachEngineering.org, Integrated Teaching and Learning Program, College of Engineering, University of Colorado, Boulder
Summary: In this week-long activity, student teams in grades 5 – 7 study the effects of evaporation by observing and measuring the ongoing evaporation of water in pans that contain soil or other variables, then assess what factors may affect evaporation.
Grade Level: 5 – 7
Time: 135 minutes over a week. (20 minutes on the first day, then 5-15 minutes each day for a week, then 45 minutes to conclude.)
Introduction
The engineers at Splash Engineering (the students) have been commissioned by Thirsty County to conduct a study of evaporation and transpiration in their region. During one week, students observe and measure (by weight) the ongoing evaporation of water in pans set up with different variables, such as adding soil or plants to the water, and then assess what factors may affect evaporation.
Engineers consider evaporation in the design and operation of dams, especially in the site selection because of its potential to cause substantial water loss. That’s particularly true in hot and arid environments. Typically, engineers and hydrologists use computer models and spreadsheets to estimate a reservoir’s water “budget,” taking into account the effects of evaporation on its storage. The information from an evaporation study provides the water budget with more accurate regional estimates of expected water loss due to evaporation and transpiration.
- Define evaporation and transpiration.
- Describe how soil helps retain water to be available for plants.
- Recognize that evaporation is an important consideration in the design and operation of dams
- Structure and function in living systems
- Populations and ecosystems
ITEA
- Design and use instruments to gather data. [Grades 6 – 8]
- Solve real world problems involving division of unit fractions by using visual fraction models and equations to represent the problem [Grade 5]
- Develop a uniform probability model by assigning equal probability to all outcomes, and use the model to determine probabilities of events. [Grade: 7]

Copyright © ITL Program, College of Engineering, University of Colorado at Boulder.
- 3 identical cake pans or plastic containers
- 3 platform scales
- soil or dirt to fill pan one-third full
- soil or dirt with shallow-rooted plants (such as a chunk of sod or weeds dug from a field), enough to fill pan one-third full
- masking tape and marker (to label pans)
Procedure
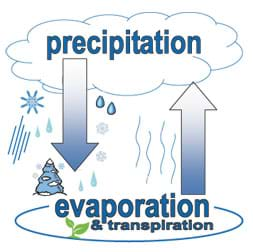
Everyone in this room has seen precipitation. (Write “precipitation” on the board.) What do rain and snow have in common? Rain and snow are both examples of precipitation, of water forming into liquid or solid form and falling from the sky to the ground. The water cycle includes another process, called “evaporation,” that is just as important as precipitation. (Write “evaporation” on the board.) Who can tell me what evaporation is? (Take suggestions from students.) Evaporation is the process when liquid water converts into water vapor and rises into the air.

Copyright © Denise W. Carlson, ITL Program, College of Engineering, University of Colorado at Boulder
Has any one heard of transpiration? (Write “transpiration” on the board.) Transpiration occurs when plants “breathe” and is similar to evaporation because a change from liquid water to water vapor occurs. Plants draw water from the ground through their roots and keep it inside their plant bodies. When the plants open their stomata (tiny holes in the leaves) to take in carbon dioxide for photosynthesis, some of the water stored within the plant escapes as water vapor and travels up into the atmosphere. This water vapor that escapes from the plant is similar to the water vapor you see when you exhale on a cold day. That little puff of “smoke” you see is really a tiny water vapor cloud.
| engineer: | A person who applies her/his understanding of science and math to creating things for the benefit of humanity and our world. |
| evaporation: | The process whereby liquid water is converted to water vapor. |
| hydrologic cycle: | A continuous process by which water is evaporated and transported from the Earth’s surface (including the oceans) to the atmosphere and back to the land and oceans. Also called the water cycle. |
| transpiration: | The passage of watery vapor from a plant to the atmosphere through the plant’s pores. |

Copyright © Megan Podlogar, ITL Program, University of Colorado at Boulder.
Before the Activity
- Gather materials and make copies of the Witnessing Evaporation Worksheet.
- Click here for .pdf of the Evaporation Worksheet answers.
- Use a marker and masking tape to label the pans “A,” “B” and “C.”
With the Students
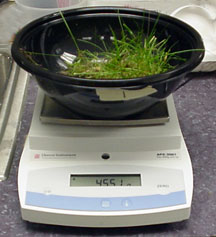
- Begin the experiment by preparing the three pans. All three pans should be the same size and shape. In pan A, place enough soil that contains living grass or weed plants to fill about one-half of the volume of the pan. In pan B, place enough soil to fill about one-half of the volume of the pan. In pan C, fill one-half of the volume of the pan with water only.
- Place each pan on its own scale.
- Add water to pan A until water reaches the top of the soil, without drowning the living plants. Add the same amount of water to pan B. Record the mass of each of the pans A, B and C, so that the change in mass can be calculated throughout the week.
- Place all three pans on a windowsill or on a table near a window, keeping the scales under each pan.
- Once a day for a week (including the setup day), have students observe and record on their worksheets the weight of each pan.
- At the end of the week, after recording the last weight, have students graph their results, as directed on the worksheet, and answer the six questions on the worksheet.
- Conclude with a class discussion that reviews the six worksheet questions.
- Assign students to write short paragraphs on the backs of their worksheets summarizing their findings, as if they were engineers reporting to the mayor of Thirsty County, making sure to inform him/her why these findings are important to the design of the county’s dam.
Pre-Activity Assessment
Activity Embedded Assessment
Post-Activity Assessment
For lower grades, have students complete the worksheet working in groups and assist them with the table, graph, and discussion questions.
Additional Resources
Water Cycle video: EPA’s one-minute kid-friendly animation explains the water cycle.
USGS Water Science fpr Schools includes an explanation of where the world’s water comes from.
USDA has a wealth of agriculture-related resources for educators , from animated time-lapse maps showing the extent of the 2012 drought to soil education resources, the world’s top plant database, and a lesson plans on soil water.
Dig It! The Secrets of Soil, an exhibit at the Smithsonian Institution from 2008 until 2010, features an interactive guide to minerals, games that test one’s knowledge of exotic soils around the world, and other fun, fascinating material.
Down the Drain Project: How much water do you use everyday in your home? How does that compare with other places? This collaborative program developed by the Stevens Institute of Technology’s Center for Innovation in Engineering and Science Education lets students collect and share data on daily water consumption with peers from around the world–and see their personal impact on the environment. By the way, according to the USGS, the average American uses between 80-100 gallons of water per day.
Water Detectives: The San Antonio (Texas) Water System offers a series of activities on water use, including this one for middle school students on individual water consumption. (Worksheet included).
Contributors
Jeff Lyng, Kristin Field, Megan Podlogar, Denise W. Carlson
© 2008 by Regents of the University of Colorado. The contents of these digital library curricula were developed by the Integrated Teaching and Learning Laboratory under National Science Foundation GK-12 grant no. 0338326, and the Discovery-Learning Apprentice Program at CU-Boulder’s College of Engineering and Applied Science.
Filed under: Class Activities, Grades 6-8
Tags: Agricultural Engineering, Civil Engineering, dam, drought, Earth Science, evaporation, soil, Water Resources


