


Choose Your Best Way
Lesson from IEEE’s TryComputing.org. Click HERE for PDF of full lesson from TryEngineering.org.
Summary
In this lesson on using mathematical modeling to solve real-world problems, middle and high school students work in teams to build a graph-theory model of their city’s map, then use it to find the best route to school, evaluate their solutions, and present their reflections to the class.
Grade level: 7 -12
Time: Two 45-minute sessions
Engineering connection
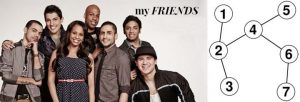
Graph theory – the study of graphs – is a visual way to represent or model relationships between objects that is used computer science, engineering, and mathematics. For example, software engineers use graphs to represent communication networks, data organization, computational devices, the flow of computation, and more. On social network websites like Facebook, software engineers exploit graph theory to analyze your “friends,” track your and their interests, and market products. They also can use graph theory to design integrated circuits and represent the structure of a website. The vertices are the available web pages and the edges are the connections (directional) between pages.
Learning objectives
After doing this activity, students should be able to:
- Understand and develop a mathematical model
- Apply mathematical modeling and graph theory to solve a problem
- Understand computer algorithmic thinking
- Work in teams
Learning Standards
NCTM’s Principles and Standards for School Mathematics
Number and Operations Standard: Compute fluently and make reasonable estimates
Geometry Standard:
- Specify locations and describe spatial relationships using coordinate geometry and other representational systems
- Use visualization, spatial reasoning, and geometric modeling to solve problems
Measurement Standard:
- Understand measurable attributes of objects and the units, systems, and processes of measurement
- Apply appropriate techniques, tools, and formulas to determine measurements.
Problem Solving Standard:
- Apply and adapt a variety of appropriate strategies to solve problems.
- Solve problems that arise in mathematics and in other contexts.
- Representation: Use representations to model and interpret physical, social and mathematical phenomena
Common Core State Standards for Mathematics
- Quantities • Reason quantitatively and use units to solve problems
- Modeling with Geometry • Apply geometric concepts in modeling situations
- International Technology and Engineering Educators Association’s Standards for Technical Literacy
- Standard 2: Students will develop an understanding of the core concepts of technology.
- Standard 3: Students will develop an understanding of the relationships among technologies and the connections between technology and other fields of study.
Graph theory tutorials and activities from the University of Tennessee, Martin
Materials
Student Resource Sheets [page 6 of PDF]
Student Worksheets
- Search Shortest Path [Pages 7-9 of PDF]
- Review & Evaluation [Page 10 of PDF]
For each team:
- Map of local town or city
- Ruler
- eraser
- pencil
- pencil sharpener
- marker pen
Procedure
1. Show students the Student Reference Sheet. This may be read in class, or provided as reading material for the prior night’s homework.
2. Divide students into groups of four or five.
3. To introduce the lesson, discuss with students the use of networks in daily life. For instance road and rail systems, connections via social media and computer networks. Advanced option: Make a presentation using electronic map software or automotive navigation system.
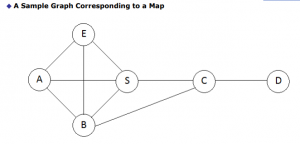
4. Teams use the grid on their worksheet to calculate distances between points on the map and use the model to develop the most efficient route to school.
5. Student teams complete an evaluation/reflection sheet and share their experiences with the class.
Lesson extension
Optional writing activity: Explore how the Internet finds the website you want when you tell your browser to go to CNN.com or Google.com. Write an essay or paragraph explaining how this relates to the graph problem described in this unit.
Related activities
In these TeachEngineering activities contributed by the College of information Science and Technology at the University of Nebraska-Omaha, students learn and apply concepts and methods of graph theory to analyze data for different relationships, such as friendships and physical proximity. They are asked about relationships between people and how those relationships can be illustrated. As part of the lesson, students are challenged to find the social graph of their friends.
For middle school activities, see TeachEngineering’s It’s a Connected World: The Beauty of Network Science curricular unit developed by Johns Hopkins University’s Whiting School of Engineering.
Graph Theory in Drama [Grades 9-12; 30 minutes]
Using Graph Theory to Analyze Drama [Grades 9-12; 60 minutes] 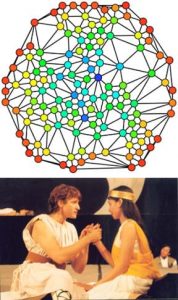
Students analyze dramatic works using graph theory. They gather data, record it in Microsoft Excel and use Cytoscape (a free, downloadable application) to generate graphs that visually illustrate the key characters (nodes) and connections between them (edges). The nodes in the Cytoscape graphs are color-coded and sized according to the importance of the node (in this activity nodes represent characters in the work and their relative importance to the story).
Making the Connection [Grades 9-12; 60 minutes.]
One of the simplest uses of graph theory is a family tree that shows how different people are related. Another application is social networks like Facebook, where a network of “friends” and their “friends” can be represented using graphs. In this TeachEngineering activity contributed by the College of information Science and Technology at the University of Nebraska-Omaha, students learn and apply concepts and methods of graph theory to analyze data for different relationships such as friendships and physical proximity. They are asked about relationships between people and how those relationships can be illustrated. As part of the lesson, students are challenged to find the social graph of their friends.
Graphing the Spread of Disease [Grades 9-12; 90 minutes]
Students simulate disease transmission by collecting data based on their proximity to other students. One option for measuring proximity is by having Bluetooth devices “discover” each other. After data is collected, students apply graph theory to analyze and summarize their data and findings in lab report format. Students learn real-world engineering applications of graph theory and see how numerous instances of real-world relationships can be more thoroughly understood by applying graph theory. Also, by applying graph theory the students are able to come up with possible solutions to limit the spread of disease. This activity is intended to be part of a computer science curriculum and knowledge of the Java programming language is required. To complete the activity, a computer with Java installed and appropriate editing software is needed.
Curb the Epidemic! [Grades 7-10; 45 minutes]
Using a website simulation tool, students build on their understanding of random processes on networks to interact with the graph of a social network of individuals and simulate the spread of a disease. They decide which two individuals on the network are the best to vaccinate in an attempt to minimize the number of people infected and “curb the epidemic.” Since the results are random, they run multiple simulations and compute the average number of infected individuals before analyzing the results and assessing the effectiveness of their vaccination strategies.
Recommended Reading
- A Beginner’s Guide to Discrete Mathematics (ISBN: 978-0817642692)
- Introductory Graph Theory (ISBN: 978-0486247755)
- Beginning Programming All-In-One Desk Reference For Dummies (ISBN: 978- 0470108543)
- Schaum’s Outline of Graph Theory (ISBN: 978-0070054899)
Credit: Lesson developed by Shuang Liu, an IEEE Student Member from Hannover, Germany, as part of the IEEE TryComputing.org Lesson Plan Competition.
Filed under: Class Activities, Grades 6-8, Grades 9-12, Lesson Plans
Tags: algorithm, Class Activities, Computer Science, Euler, Grades 6-8, Grades 9-12, graph theory, Lesson Plan, mathematical modeling, Mathematics, network science, NGSS, programming, Seven Bridges of Konigsburg, traveling salesman problem