Posted on January 29th, 2016 by Mary Lord
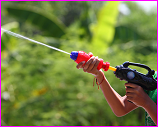
 Teams of high school students use their understanding of projectile physics and fluid dynamics to calculate the water pressure in squirt guns by measuring the range of the water jets. They create graphs to analyze how the predicted pressure relates to the number of times they pump the water gun before shooting.
Read More
Filed under: Class Activities, Grades 9-12 | Comments Off on A Shot Under Pressure
Tags: Bernoulli, calculations, Class Activities, data analysis, fluid dynamics, forces and motion, Grades 9-12, graph, Mathematics, measurement, Physics, pressure, projectile, Super Soaker, variables, velocity, water gun
Posted on June 19th, 2014 by Mary Lord
 In this activity, elementary students in grades 3 to 5 learn about reverse engineering and how to collect and represent data graphically by investigating different balls and their abilities to bounce.
Read More
Filed under: Class Activities, Grades K-5 | Comments Off on Ball Bounce Experiment
Tags: balls, data, graph, Materials Engineering, Mathematics, Reverse Engineering, soccer, Sports
Posted on April 16th, 2013 by Mary Lord
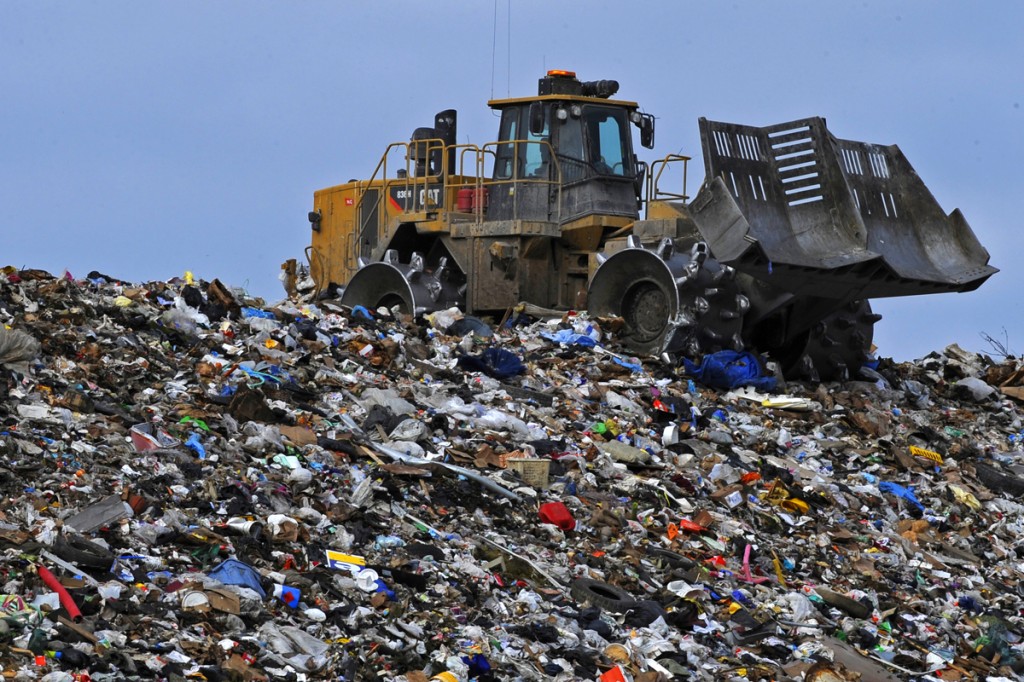
 In this activity, teams of students in grades 5 to 7 learn about environmental, civil, and sanitation engineering by designing and building model landfills that hold the most garbage, minimize costs, and prevent trash and contaminated “rainwater” from polluting the nearby “city.” Teams test their landfills, and graph and compare designs for capacity, cost, and performance.
Read More
Filed under: Class Activities, Grades 6-8, Grades 6-8, Lesson Plans | Comments Off on What a Dump!
Tags: build, Class Activities, Design, dump, Environmental Engineering, graph, Landfill, Mathematics, Pollution, sanitation, Trash
 Teams of high school students use their understanding of projectile physics and fluid dynamics to calculate the water pressure in squirt guns by measuring the range of the water jets. They create graphs to analyze how the predicted pressure relates to the number of times they pump the water gun before shooting.


 In this activity, elementary students in grades 3 to 5 learn about reverse engineering and how to collect and represent data graphically by investigating different balls and their abilities to bounce.
 In this activity, teams of students in grades 5 to 7 learn about environmental, civil, and sanitation engineering by designing and building model landfills that hold the most garbage, minimize costs, and prevent trash and contaminated “rainwater” from polluting the nearby “city.” Teams test their landfills, and graph and compare designs for capacity, cost, and performance.