


I Breathe WHAT?!
Activity courtesy of TeachEngineering, the University of Colorado Boulder College of Engineering’s free digital library. Cleaning the Air, a companion activity, challenges students to design, build, and test an air pollution filtering device. Both activities are part of a broader TeachEngineering curricular unit on environmental engineering.
Grade level: 6 – 8
Time: 1 hour, 45 minutes (two 50-minute classes, ideally separated by a weekend)
Summary
Students gain an appreciation of how much dust, pollen, and other particulate matter is present in the air around them by placing “pollution detectors” in various locations and then examining the captured air particles to determine which places have more or fewer airborne particles. Quantifying and describing these particles is a first step towards engineering methods of removing contaminants from the air in a companion activity, Cleaning the Air.
Engineering Connection
Engineers of all disciplines creatively design new technologies to reduce the production of air pollution. Some engineers examine the types of chemicals released in the manufacturing process, and re-design new ways of production or methods to remove the harmful chemicals before the factory air is released into the atmosphere. Others re-design engines to make more efficient the fuel burning process and/or reduce chemical emissions.
Learning Objectives
After this activity, students should be able to:
- Identify some examples of particulate matter in the air.
- Create a particulate matter collector.
- Hypothesize why some locations have more particles in the air than other locations.
- Describe why engineers count particulate matter while observing air quality.
Learning Standards
Next Generation Science Standards
MS-ESS3-3. Apply scientific principles to design a method for monitoring and minimizing a human impact on the environment [grades 6 – 8]
Common Core State Mathematics Standards
- Summarize numerical data sets in relation to their context [Grade 6]
- Reporting the number of observations. [Grade 6]
International Technology and Engineering Educators Association (ITEEA)
- Students will develop an understanding of the relationships among technologies and the connections between technology and other fields of study. [Grades K – 12]
- Students will develop an understanding of the characteristics and scope of technology. [Grades K – 12]
Materials List
Each group should have:
- One 3″ x 5″index card
- Clear Packaging tape
- One pair of scissors
- Piece of string, ~ 20 cm long
- A (single) hole puncher
- Microscope (preferred) or magnifying glass
- A piece of graph paper
- 2 copies of the Pollution Detector Worksheet
More Curriculum Like This
Got Dirty Air? Elementary lesson
Students are introduced to the concept of air pollution and technologies that engineers have developed to address it.
The Air We Breathe Middle School Lesson
Students learn what causes air pollution and how to investigate the different pollutants that exist, such as toxic gases and particulate matter. They also investigate the technologies developed by engineers to reduce air pollution.
What’s Air Got to Do with It? Elementary Lesson
Students are introduced to the concepts of air pollution and air quality in a three-part unit that includes using M&M candies to create pie graphs that express their understanding of the composition of air.
Introduction to Environmental Challenges in China Middle School Lesson
Students learn about the effects of indoor and outdoor air pollution that China is struggling to curb with the help of engineers and scientists.
Introduction/Motivation
Have you ever noticed tiny particles in the air? We breath little pieces of stuff all the time — some of it comes from the ground (dust), some of it from our bodies or clothes (lint, hairs, little pieces of skin), and some of it comes from smoke stacks, car tires, or all sorts of other places. There are a lot of bits and pieces of “stuff” in the air – a quart of air usually contains about 70,000 small particles, and the average house collects about two pounds of dust per week! Consider a vacuum cleaner bag after carpets — which do not appear overly dirty — have been vacuumed several times; the bag is generally very full, and dirt is compacted in the bag, making it quite heavy.
Most of the stuff in our air is very small — much less than an inch in size. Scientists use a very small unit of measure called a micron or micrometer to measure things this small. There are 25,400 microns in an inch. (Have students hold their fingers an inch apart.) People can see things as small as about 10 microns if the light is good. Particles that are smaller than that require a microscope to see them. Ninety percent of the particles in the air are smaller than 10 microns, so most of the specks in the air are too small for people to see without a microscope.
Our bodies are designed to filter particles out as we breathe, but having too many particles in the air can make some people sick. People who suffer asthma may notice their condition worsening in areas with high concentrations of particulate matter in the air, and people’s eyes and noses may become more easily irritated. Some particles contribute to the formation of smog. Because particles can make people sick, the U.S. Environmental Protection Agency (EPA) creates regulations for the amount of “stuff” that can be present in the air. The EPA has made a rule that there cannot be more than 0.0002 grams of particles in a cubic meter of air – that is much less than the weight of water in a very light cloud!
Engineers work to make sure that factories, cars, incinerators and other buildings that produce small particles only release clean air. There are many different ways to clean the particles out of the air: engineers wash air by bubbling it through water in air scrubbers, they vacuum air through bags in filters, and they even zap air with electricity in electrostatic precipitators.
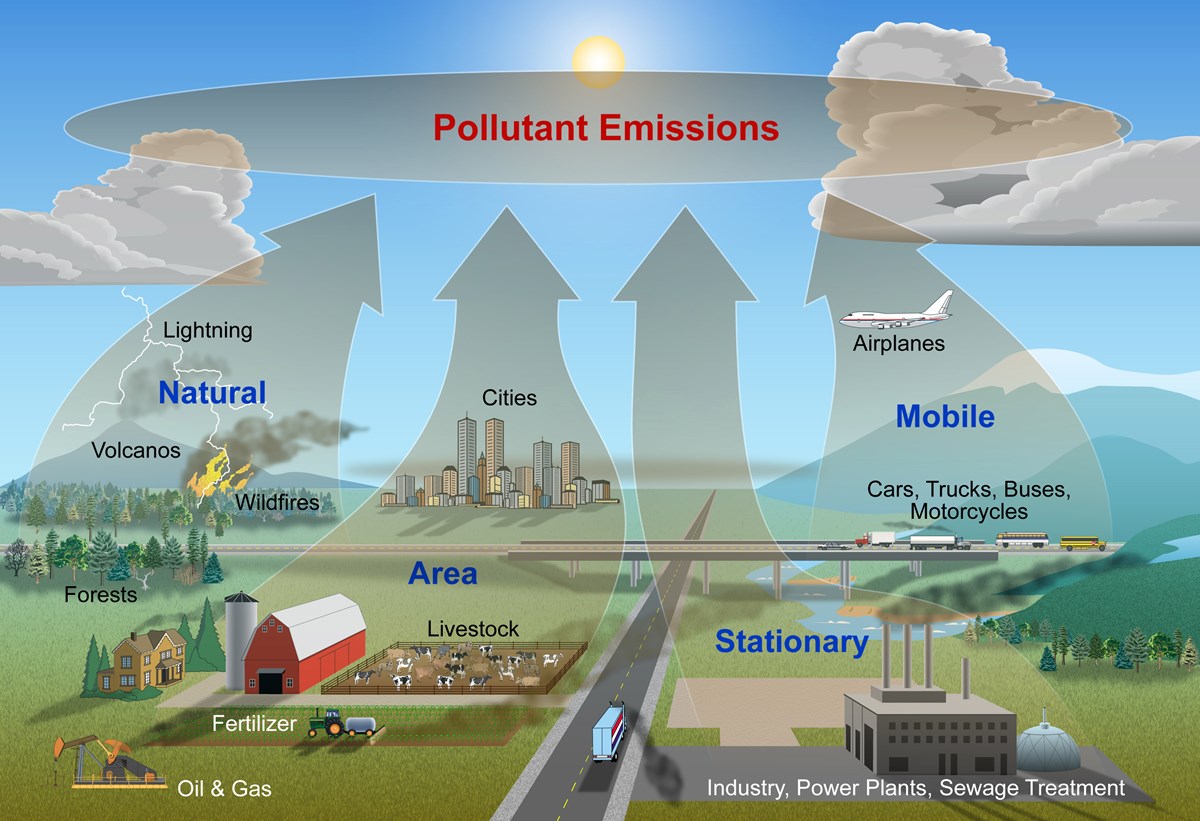
Air pollutants come from a variety of sources, both natural and man-made. Natural sources include wind kicking up soil particles, salt from waves crashing on the beach, and volcanoes! Man-made sources are probably easier to think of, with some examples being: char emitted from combustion (cars and cooking), and mining and construction kicking up dust.
Not all of the particles in the air are bad; for example, dust in the air makes helps to create vibrant red sunsets. Dust can also help raindrops form. Water particles make air more pleasant to breathe. If fact, some particles help people develop immunity to sicknesses. In this activity, we are going to try and figure out what kind of particles are in the air around us.
Procedure
With the Students
Ask students the following questions:
- What are some man-made sources of particulate matter? (Answer: Carbon (char) emitted from the tailpipe and tires of cars, dust kicked up from construction, emissions from power plants.)
- How can we reduce any of the above sources? (Answer: Drive less (carpool and take buses), drive slower, wet the ground at construction sites (especially where trucks enter and exit), and use less electricity.)
Begin by constructing the pollution collectors. This part of the activity does not take very long, and can be completed in 10 or 15 minutes of class. Further discussion and exploration will take more time after the pollution collectors have been hanging up for some time (over a weekend or at least overnight).
To make and deploy their pollution collectors, students should:
- Cut a hole in an index card. The hole can be square, round or any other shape that students like, but it should have at least one area that is as large as a 2″ x 2″ grid on the graph paper.
- Punch a hole in the index card near one end. Thread the length of string through the hole and tie it in a loop. The pollution detector should hang loosely from the string.
- Write information on the index card for future identification (i.e., name, date, class period). Label the index card with a phrase such as “Pollution Monitor – PLEASE DO NOT REMOVE” so that the collector will not be thrown away by someone who thinks it is trash.
- Put a piece of packaging tape over the larger of the holes cut in the card. The sticky side of the tape will collect airborne particles, so students should be careful not to touch the sticky side or to stick the tape to their desk, paper, their clothes or anything else.
- Hang the pollution detector at a location that you would like to investigate. More particles will be collected at areas of greater airflow, such as near vents. Other interesting places could be nearby classrooms, the cafeteria, the kitchen, the teacher’s lounge, a copy machine, a bus stop, or really just about anywhere else. (Note: Remind the students not to interrupt other teachers’ classes or go places that they are not allowed.) These detectors are not waterproof, so if students place the detectors outside, they should place them so that they will be protected from weather.
- Leave the pollution detectors hanging for at least 24 hours, preferably longer (over a weekend is good).
After the pollution detectors have been collecting particles for some time, they are ready to be analyzed.
To analyze the pollution detectors, students should:
- Cut a small square out of a sheet of graph paper (i.e., 1 grid, or a 2″ by 2″ square). Each group should cut a square the same size so that they are looking at an equal area on the surface of their pollution detector.
- Place the paper on the microscope stand so that the hole is centered in the microscope’s field of view.
- Place the pollution detector over the paper on the microscope stand, sticky side up. Choose an area with few particles, an area with many particles and an area with an intermediate number of particles.
- Count the number of particles in each area chosen (few, many and intermediate). Record number on the Pollution Detector Worksheet.
- Identify at least three kinds of particles (i.e., fuzzy pollen, hairs and small pieces of soil). On the Pollution Detector Worksheet, describe and draw some of the particles seen through the microscope.
- Compute the average number of particles on the pollution detector by adding the number of particles counted in each area and dividing by three.
- Compare the number of particles on each pollution detector with other pollution detectors to find areas with many particles in the air, and areas with fewer particles in the air. (Note: Make a list of the groups’ collection “places” on the board or an overhead. Next to the appropriate location, students should write their average number of particles for comparison.)
Assessment
Pre-Activity Assessment
Brainstorm: Invite students to think about what things might make “dust.” Write their answers on the board. Have students vote on whether each kind of dust might make people sick. Also, discuss which particles are the result of human activity have students brainstorm ways to reduce dust emissions from human activities. Remind students that no idea or suggestion is “silly.” All ideas should be respectfully heard.
Activity Embedded Assessment
Worksheet: Have students complete the Pollution Detector Worksheet. Students should record written notes of their counts and observations through the microscope.
Post-Activity Assessment
Class Discussion and Collaboration: Solicit, integrate and summarize student responses. Compile data from all the student groups to identify and compare areas with high and low amounts of particles in the air. Invite students to hypothesize where the particles in each area might come from that float in the air. Challenge the students to think of ways to test their hypothesis. Students could also discuss which particles are the result of human activity and ways that the impact of that activity could be reduced.
Map It! Students should make a map of where the pollution collectors were placed, including indication of the location of the collector and the average number of particles collected for each location. Place that map in the classroom, out in the hall or library for everyone to see.
Safety Issues
Students should be cautious when they are placing their pollution detectors, especially if they need to climb up to hang their detectors. They should think about what could go wrong before they chose to put their detector in a certain place (for example, hanging a paper detector near a stove could present a fire hazard).
Troubleshooting Tips
Students should be careful not to touch the sticky side of their pollution detector or drop it on the ground.
There may be so many very small particles that it is difficult to count; in that case, students should only count “large” or “easy to see” particles.
Remind the students not to interrupt other teachers’ classes or go places that they are not allowed.
These detectors are not waterproof, so if students place the detectors outside, they should place them so that they will be protected from weather.
Activity Extensions
Many areas monitor the amount of particles in the air because of public health concerns. Have students make a graph of the amount of pollution in the air as a function of time of day. When is the pollution highest? (Answer: often in the late morning) When is it lowest? (Answer: often at night/early morning) What could cause the change in pollution levels? (Answer: weather, driving habits, fires or industrial activity) Some pollution data is available online at the multi-university Center for Air, Climate, and Energy Solutions and the U.S. Environmental Protection Agency’s Air Quality Data Collection site.
The National Park Service has information and diagrams on air particle pollution types and sources. To address the increase of human populations and per-capita consumption of natural resources, the teacher may want to include the Population Education’s personal carbon-footprint estimation activity.
Activity Scaling
This activity is appropriate for all grades.
References
Howard Hughes Medical Institute, Cool Science for Kids. “Air Junk: Specks, Flecks and Particles in the Air.” (Note: Cool Science for Kids has been replaced by HHMI’s bioInteractive site for teachers, and a link to videos and other resources.
© 2005 by Regents of the University of Colorado.
Contributors
Ben Heavner; Melissa Straten; Malinda Schaefer Zarske; Janet Yowell
Supporting Program
Integrated Teaching and Learning Program, College of Engineering, University of Colorado Boulder
Acknowledgements
The contents of this digital library curriculum were developed under a grant from the Fund for the Improvement of Postsecondary Education (FIPSE), U.S. Department of Education and National Science Foundation GK-12 grant no. 0338326. However, these contents do not necessarily represent the policies of the Department of Education or National Science Foundation, and you should not assume endorsement by the federal government.
Filed under: Class Activities, Grades 6-8, Grades 6-8, Lesson Plans
Tags: air pollution, data, Environmental Engineering, investigation, measurement, NGSS aligned, pollen