


Backyard Weather Station
TeachEngineering activity is part of an Earth and Space Science and Technology curricular unit on weather and the atmosphere contributed by the University of Colorado, Boulder, College of Engineering’s Integrated Teaching and Learning Program.
Summary
Working in groups of 8, middle school students use their senses to describe what the weather is doing and predict what it might do next. After gaining a basic understanding of weather patterns, they act as state park engineers and design/build “backyard weather stations” to gather data to make actual weather forecasts.
Learning Objectives
After this activity, students should be able to:
- Observe and make predictions about the weather using their senses and observing the clouds.
- Describe the relation between weather patterns and wind speed, air pressure, temperature, and precipitation.
- Make a weather forecast based on sensory observations, cloud characteristics, and collected weather data.
- Develop a model that describes how unequal heating of the Earth causes patterns of atmospheric and oceanic circulation that determine regional climates.
Learning Standards
NGSS: Next Generations Science Standards
MS-ESS2-6 Develop and use a model to describe how unequal heating and rotation of the Earth cause patterns of atmospheric and oceanic circulation that determine regional climates.
Common Core State Standards: Mathematics
- Display numerical data in plots on a number line, including dot plots, histograms, and box plots. [Grade 6]
- Understand that patterns of association can also be seen in bivariate categorical data by displaying frequencies and relative frequencies in a two-way table. Construct and interpret a two-way table summarizing data on two categorical variables collected from the same subjects. Use relative frequencies calculated for rows or columns to describe possible association between the two variables. [Grade 8]
International Technology and Engineering Educators Association: Technology
- New products and systems can be developed to solve problems or to help do things that could not be done without the help of technology. [6-8]
- Throughout history, new technologies have resulted from the demands, values, and interests of individuals, businesses, industries, and societies. [6-8]
Engineering Connection
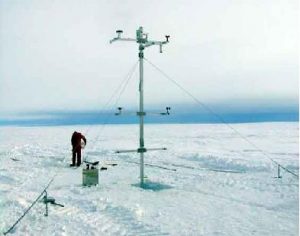
Who cares about the weather? A lot of people do, including engineers! Engineers have designed modern weather forecasting equipment, such as weather balloons, satellites, Doppler radar, and computer simulation programs to help meteorologists make accurate weather forecasts. Engineers have also designed the “automatic weather station” (AWS), which is used to collect weather data automatically in remote areas, such as the faraway mountains or the icy Antarctica. Often, mechanical engineers design and build the high-tech equipment that is used for weather forecasting. They also test the equipment to make sure that it is safe to use and can withstand severe atmospheric conditions. Electrical engineers also design the electronics and circuitry to measure and relay weather data accurately.
Materials
Each group needs:
- Weather Forecasting Worksheet, one per student
- Weather Station Worksheet, one per team
- Forecasting with Clouds Reference Sheet, one per team
- 1 large box or crate to put the different weather forecasting tools together as a weather station
- The following materials for each weather forecasting tool:
Weather Tool #1: Wind Vane
Wind Vane Worksheet plus:
- cardstock
- pencil with eraser
- pencils and markers
- straight pen
- scissors
- small piece of modeling clay
- hot glue
- plastic straw
- compass
- piece of cardboard
Weather Tool #2: Barometer
Barometer Worksheet plus:
- 2-liter plastic bottle
- food coloring
- clear plastic cup
- water
- marker
Weather Tool #3: Thermometer
- maximum/minimum thermometer
- tape
- climatology data for your area
Weather Tool #4: Rain Gauge 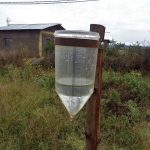
Rain Gauge Worksheet plus
- wide glass
- masking tape
- straight, thin jar (a graduated cylinder works best)
- water
- ruler
Introduction/Motivation
People have been forecasting the weather for thousands of years. Even you forecast the weather when you look out the window or step outside in the morning before deciding what to wear. In this case, you are using your senses to forecast the weather. You might be looking at the shape and color of the clouds in the sky, feeling how warm or cool the air is, or watching the trees to see if they are swaying in the breeze.
Modern weather forecasting is more complicated than using our senses to predict the weather — it really depends on the work of engineers and scientists. What are some of the engineering devices that are used today to forecast the weather? (Possible answers: Weather balloons, satellites, Doppler radars, computer programs, etc.) So, if engineers design this equipment, who uses it? Meteorologists and climatologists use these engineering devices to make weather forecasts. Everybody who plans a picnic, a camping trip, or rides on an airplane depends on these weather forecasts. For example, pilots need accurate weather forecasts to make air travel safe and comfortable for their passengers. Certain types of weather conditions, such as extremely high winds and severe thunderstorms, can make air travel unsafe. Greater accuracy in predicting the path and strengthn of a hurricane can help people stay safe. You might also need to know the weather if you are planning a camping trip — the wilderness is beautiful, but it can be dangerous to be caught outside in a storm.
 Now let’s try to imagine how people predicted the weather before engineers and scientists developed modern forecasting equipment (as shown in the photo, left, of an automatic weather station). How do you predict the weather? For example, when you see a clear blue sky on a warm day, what do you expect to happen? Probably not much — your experience of this weather pattern has taught you that clear blue skies on warm days mean fair weather. What if you looked up at the sky and saw a gray cloud, hanging low in the sky? You know from experience that dark gray clouds usually bring rain or snow. In both cases, you are relying on the observation of known patterns to predict the weather. Observing weather patterns over time to predict the future state of the weather is how people forecast the weather for thousands of years before engineers and scientists developed modern weather forecasting equipment.
Today, you will be an engineer! You will use your senses to observe weather patterns and then design forecasting equipment to make a weather forecast. Let’s say that each one of you is working as an engineer for your State’s Parks Division. It is a holiday weekend, and a lot of people are planning to camp in the park. As a State Park engineer, it is your job to build a “backyard weather station” and make a weather forecast to determine whether the weekend will be safe and pleasant for camping. Let’s get started!
Procedure
See activity website for vocabulary and background information and graphics on air masses, weather fronts, and weather measuring tools on the TeachEngineering activity website.
Before the Activity
- Gather materials and make copies of the worksheets.
- Have the groups working with thermometers gather climatology data for their areas. Go to http://www.noaa.gov/ to access weather information.
- To begin the activity, divide the class into groups of eight students.
With the Students
- Conduct one of the pre-activity assessment activities (see the Assessment section).
- Review the activity tasks and learning objectives.
- Give each student a Weather Forecasting Worksheet.
Part 1: Weather Observation Using our Senses
Note: This is a good time to take students outside. As a class, create a list of weather observations. Pay special attention to the color and shape of the clouds. Take this list back inside to help students draw pictures of the current weather state on their worksheets. Using these pictures, ask them to predict what they think the weather will do next.
Background Information
The most basic way to observe and make predictions about the weather is by using our senses. Sight is the easiest sense to use to forecast the weather. You can see when it is raining or snowing. You can see the different types of clouds in the sky. Touch is also an easy sense to use. When the sun is shining, you can feel it on your face. You can feel it become colder when a cloud blocks the sun. You can also use touch to sense how strong the wind is and from which directions it is blowing. Hearing helps us detect weather phenomena. When you hear thunder, you know a storm is nearby. You can hear wind blowing harder or softer through trees or as it whips around your ears. Smell can also help us predict the weather! Have you ever smelled the air before a rainstorm? It has a distinct smell. Snowstorms have a certain smell, too.
Part 2: Weather Forecasting Using Clouds
Explain that we can observe the shape, color and location of the clouds in the sky to make predictions about the weather. Have students draw pictures of each type of cloud on their worksheets and write short descriptions in the spaces provided. See the attached Forecasting with Clouds Reference Sheet for descriptions and pictures of these types.
Background Information
When clouds are in the sky, you can observe their shape, color and placement to predict what the weather will do. Different clouds help meteorologists tell what kind of weather is around them. We will consider cirrus, cumulus, altocumulus, nimbostratus and cumulonimbus types of clouds to help us predict the weather.
Note: If you are completing this activity over several class periods, this is a good place to stop and do the activity-embedded assessment (see the Assessment section).
Part 3: Building a Weather Station 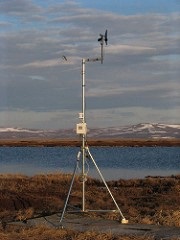
Background Information
Devices such as wind vanes, barometers, thermometers and rain gauges can help us observe the weather. Coupled with our sensory observations and knowledge of the clouds, we can make more accurate weather forecasts. Engineers have designed weather forecasting stations that can be built and operated almost anywhere on Earth. For example, engineers designed the “automatic weather station” (AWS), which is used to collect weather data automatically, saving human labor and enabling measurements from remote areas, such as Antarctica. These stations typically have a thermometer to measure temperature, an anemometer to measure wind, a hygrometer to measure humidity, a barometer to measure pressure. Some stations have a ceilometer, a device that uses a laser or other light source to determine the height of a cloud base.
We can engineer a weather station similar to an AWS to help us collect weather data. Our Backyard Weather Station will include a wind vane to observe the wind direction, a barometer to observe air pressure, a thermometer to record the air temperature and a rain gauge to measure any rainfall.
- Divide the class into their Backyard Weather Station groups (eight students per group) and have them agree upon a team name.
- Briefly describe each of the tools that will be used to build a Backyard Weather Station (wind vane, barometer, thermometer and rain gauge). Explain what each tool does and how it will help the students understand what the weather is doing.
- Within their groups of eight, have students forms pairs and decide which tool they would like to use.
- Give each pair the corresponding Weather Tool instructions worksheet.
- Have each pair review the list of the materials they need. Group need sturdy containers for their Backyard Weather Stations. Wooden crates or plastic tubs work well. Students can often find or borrow suitable containers at/from home.
- Help students gather materials and begin working on their weather tools.
- Give each pair time to test their weather tool, take data, and complete their Weather Tool worksheets.
- Have the pairs come together in their larger groups to design, test and finalize the configuration of their Backyard Weather Stations. (Note: It is suggested that the group with the thermometers also start to design the box or crate for the final weather station.)
- Have each group take data over a period of time. (Note: It is suggested that students take data for at least a few days.)
Part 4: Putting it all Together
Background Information
Now that we have engineered our weather stations and collected data, we can make a weather forecast. When we combine the information about wind direction, pressure, temperature and precipitation, we can predict the onset of large weather systems, such as weather fronts, which are caused by the movement of air masses.
- After sufficient weather data has been collected, have students complete the Weather Station Worksheet. Each group will make a detailed weather forecast using the weather data obtained from their Backyard Weather Stations.
- Have each team present their weather forecasts to the rest of the class.
Troubleshooting Tips
- The activity is most effective if weather data can be collected at the same time each day for at least a few days.
- For consistent weather data, locate the Backyard Weather Station in roughly the same place.
- For more interesting results and discussion, lead this activity during periods when stormier weather is expected.
Investigating Questions
- What information do people look for in a weather forecast? (Possible answers: Air temperature maximum and minimum, chance of rain, snow or storms, gusty winds.)
- Where can we find weather forecasts? (Possible answers: Newspaper, television, radio, Internet.)
- How do weather forecasts help people? (Possible answers: Forecasting the weather helps us plan activities such as sporting events, picnics and vacations. Understanding what the weather is doing can prevent people from getting hurt in natural hazards such as floods, hurricanes and tornadoes.)
Assessment
Pre-Activity Assessment
Discussion: Have students discuss what kind of information they expect to find in a weather forecast. What kind of information would they want to gather to make a weather forecast? (Answer: A typical forecast contains information about the current weather conditions. Usually, it describes the temperature, the overall conditions [that is., rainy, sunny, cloudy, windy, stormy, etc.]. The wind speed is typically given in miles per hour [mph], and the visibility is given in miles. The barometric pressure [air pressure[ is reported, along with information about whether the barometric pressure is rising or falling. Finally, most weather forecasts provide a week-long forecast outlining the daily temperatures and chance of rain or sun. See the Investigating Questions sections for other leading questions.)
Review for Prior Knowledge: Give small groups of students a printout of the day’s weather forecast. Ask the students to interpret the information, and have each group explain one portion of the forecast to the rest of the class.
Activity-Embedded Assessment
Basic Weather Forecast: Have students make weather forecasts using their sensory observations and knowledge of the clouds. For these basic weather forecasts, have them predict if the weather is going to change or stay the same. Do they predict that it is going to become colder or warmer? Is it going to rain or snow? Is it going to become windy? This could be done in class or as a homework assignment. Share and compare the students’ basic weather forecasts as a class. Reiterate how sensory weather observation and prediction is easy to do, but it is not always dependable. As State Park engineers, we want to make a more accurate forecast using weather forecasting tools.
Post-Activity Assessment
Detailed Weather Forecast: Using the weather data collected over a period of time from each Backyard Weather Station, have each group put together a detailed weather forecast. This forecast could include the observed patterns in cloud shape, air temperature, wind direction, air pressure and precipitation. Also, did they observe any weather fronts? As State Park engineers, what is their final recommendation to the visitors coming to the park this weekend? Will it be pleasant or stormy? Will it be dangerous for the visitors? What precautions should visitors take?
Weather Presentations: Give students the opportunity to choose how to present their forecast to the class. Some ideas – a newspaper report, a poster showing the relevant weather features (wind direction, precipitation, cloud shape, presence of a weather front, etc.), a typical weather forecast on a “blue board” using props for sun, rain, clouds, warm fronts and cold fronts.
Activity Extensions
- Have students enhance their weather stations with anemometers to measure wind speed and hygrometers to measure humidity.
- Have students follow the weather forecasts from the newspaper or internet while they are using their Backyard Weather Stations to predict the weather. Have them compare how similar their forecasts are to the published professional weather forecasts.
- Have student draw a flow model that incorporates the information they have learned about how atmospheric and oceanic circulation drives regional climate. [For example, the diagram could include the Sun heating a portion of atmosphere or ocean, changing pressure, and arrows indicating the movement of either ocean or water. Students could include either atmosphere or ocean or both.]
Activity Scaling
- For younger students, put together a sample Backyard Weather Station to use as a class.
- Lead younger students through Parts 1 and 2 of this activity to explain what the weather is doing based on their senses and knowledge of the clouds. As a class, make a weather forecast using a completed Backyard Weather Station.
- For older students, have them collect weather data over a longer period of time to generate a more detailed weather forecast report.
Related middle-school activities:
- Weather Basics (15 min. TeachEngineering activity on factors that effect weather, cloud formation, and instruments to measure weather.)
- Weather Forecasting (20 min. TeachEngineering activity on forecasting technologies and how improvements have helped save lives.)
- Stormy Skies (15 min. TeachEngineering activity covers basics of high and low pressure, air masses, and how engineers help improve forecasts.)
References
Australian Government Antarctic Division, Experience Antarctica, This Week In Antarctica, TWIA archives, TWIA archive 2003, Early TWIAs, “Casey Autumn Traverse,” October 23, 2007.
Detroit Public TV, Get Up! Get Out!, “Activity Ideas – Backyard Weather Station.”
Short, Nicholas M. NASA Education LandSat Remote Sensing Tutorial, “Atmospheric Circulation; Weather Systems.”
Additional resources
Build an Anemometer. TeachEngineering YouTube video on how to build a wind gauge using paper cups and straws.
Build a Simple Weather Station: Part 1, Rain Gauge. WonderStruck YouTube video on constructing a rain gauge from an empty plastic bottle.
Build a Simple Weather Station: Part 2, Barometer; Part 3, Weather Vane; Part 4, Anemometer
Severe Weather 101. The National Oceanic and Atmospheric Administration’s Severe Storms Laboratory includes weather education resources for teachers and students, including links to the international cloud atlas and cloud-viewing guide, and “Weather Friends” superhero trading cards.
Contributors
Lauren Cooper; Malinda Schaefer Zarske; Janet Yowell
Copyright
© 2007 by Regents of the University of Colorado
Supporting Program
Integrated Teaching and Learning Program, College of Engineering, University of Colorado Boulder, which developed TeachEngineering’s digital library curricula under National Science Foundation GK-12 grant no. 0338326.
Filed under: Class Activities, Grades 6-8, Grades 6-8, Lesson Plans
Tags: air mass, Class Activities, clouds, cold front, data, Design, Earth Science, Environmental science, forecast, Grades 6-8, hurricane, Lesson Plan, measurement, Meteorology, NGSS, thermometer, Weather, weather station