


Visualize STEM
Lesson and related activity courtesy of TeachEngineering.org, an online library of teacher-tested, standards-based STEM lessons. Contributed by Georgia Tech’s Partnerships for Research, Innovation, and Multi-Scale Engineering.
Summary
In this lesson, high school students learn the value of writing and art in science and engineering by designing visual diagrams to communicate the results of thermal conductivity (heat flow) experiments they have conducted to anyone with little background on the subject. The principles of visual design include contrast, alignment, repetition, and proximity; with elements including the use of lines, color, texture, shape, size, value and space.
Note: If students already have data available from other experiments, have them jump right into the diagram creation and critique portions of the activity.
Grade level: 9-12
Time: 3 hours (including 1 hour to conduct experiment and create diagram)
Engineering Connection
Learning Objectives
After this lesson, students should be able to:
- Explain the connection between art and engineering.
- Explain how research funding happens in the sciences and engineering.
- Explain the importance of clear communication and how art can help accomplish this.
- Describe images using art vocabulary.
- Explain how thermal conductivity affects heat flow.
- Design and perform an experiment.
- Evaluate the accuracy of their data and determine how to improve it.
- Construct a visual model to represent their data.
- Control experiment variables in order to determine correlation.
Learning Standards
Next Generation Science Standards
- Construct an oral and written argument or counter-arguments based on data and evidence.
- Models, mechanisms, and explanations collectively serve as tools in the development of a scientific theory.
Common Core State Mathematics Standards
- Reason quantitatively and use units to solve problems.
- Use units as a way to understand problems and to guide the solution of multi-step problems; choose and interpret units consistently in formulas; choose and interpret the scale and the origin in graphs and data displays.
- Define appropriate quantities for the purpose of descriptive modeling.
- Choose a level of accuracy appropriate to limitations on measurement when reporting quantities.
International Technology and Engineering Educators Association
- Established design principles are used to evaluate existing designs, to collect data, and to guide the design process.
- Engineering design is influenced by personal characteristics, such as creativity, resourcefulness, and the ability to visualize and think abstractly.
- The process of engineering design takes into account a number of factors.
Introduction/Motivation
Be ready to show the class the nine-slide Using Visual Art to Communicate Presentation. This PowerPoint® file provides example images to get students thinking about how images can show action.
In advance, review the Teacher’s Slide Guide [PDF] for descriptions of each slide, suggested questions to ask, and possible answers. Also make copies of the Principles and Elements of Design Handout, one per student, which is also provided as the last two slides.)
How many of you have had to draw an image of something happening? Have you ever looked at a picture and been able to tell what was going on at the time even though the image is just a still frame? Do you think being able to make images like this may be useful to us in science and engineering?
Engineers use art regularly to explain their ideas and findings to others. The way engineers get funding for their research is often through grants, and the people deciding who gets the grant money rarely have in-depth background knowledge of the engineering topic. For example, if your proposed research or project has never been done before, you may be the only one in the world who even knows about it! Thus, it is important that you are able to communicate your ideas to your audience and art is a fantastic way to do that. It is so useful, in fact, that many engineering colleges offer drawing classes and CAD (computer aided design) courses so that students can become prepared and skilled to visually present ideas and concepts in the form of diagrams, schematics and prototypes.
Next, pass out the design handout and show the class the PowerPoint® slides. The handout provides fundamental art vocabulary and examples of methods used in art. Encourage students to use the correct terms to describe images in the presentation. At each slide, give students two or three minutes to answer the questions and as they are working, ask your own to prompt them to think of new ideas. After each image, have students share their findings and what they saw. As a recap on slide 7, explain the importance of each image and how each might be used in illustrating scientific and engineering work. Note that the slides are “animated,” so each click [mouse or keyboard] brings up the next image, text or slide.)
Continue on to provide students with the content in the Lesson Background section (scroll about one-third of the way down the page), which covers the research funding process, the principles and elements of visual design [slides 8 and 9] and visualizing heat flow including the real-world example of a heat sink, which prepares them to conduct the associated activity.
Visualizing Heat Flow
(Heat flow is an easy topic for which students can design experiments and then use art to communicate the data results. Students need not know specific background mathematics to start the associated activity experimental lab, but conclude at the end with the equation of heat flow so they can see the connection between their data and the math. The lab is designed to be open inquiry, but it can be made more structured if students need more guidance.)
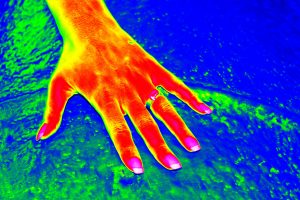
Thermal control is a vital topic in science and engineering. Humans can only survive in narrow temperature ranges, food cannot grow in certain temperatures, our mechanical and electrical equipment do not function if it is too hot or too cold, and many more challenges occur if we do not control heat flow. One common application of controlling heat flow is the use of heat sinks in electronics.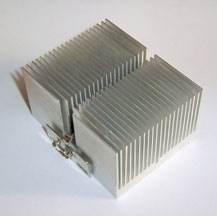
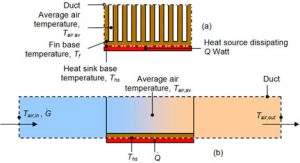
As they perform their tasks, computer chips generate a large amount of heat. If they are not kept cool, they overheat and sometimes melt. To prevent this, engineers use heat sinks (see Figures 1 and 2) to give off excess heat to the air faster than would usually happen. These heat sinks have very high rates of heat flow and so give off heat before it can build up on the chip.
Here is how it works. Heat flow can be modeled by the equation ΔQ/Δt = (-kAΔT)/x, where ΔQ/ Δt is the rate of heat flow in joules per second, k is the thermal conductivity of the material, A is the surface area of contact between two surfaces, ΔT is the difference in temperature between two objects, and x is the thickness of your material. If you want heat to flow out of your system faster, either increase k by changing the materials, increase surface area between two objects (A) or increase the difference in temperature between the objects (ΔT). If you want to slow it down, just make the material thicker (increase x).
 In Figure 2, the chip is generating the heat. The thermal interface material has a high k value, typically ~200 W/(m*K) (watts per meter Kelvin), and it increases the surface area between the chip and the chip cap. The chip cap is thicker and builds up most of the heat, increasing ΔT, and increasing the surface area to the cooling medium, usually air.
Associated Activities
- Heat Flow and Diagrams Lab – Students use the engineering design process to perform and refine an experiment that measures the thermal conductivity of different materials. After data are collected, students apply their new awareness of the principles and elements of art to create visual representations of their findings and present them to the class.
Lesson Closure
After the associated activity is completed and students have made diagrams, show them the mathematical equation ΔQ/Δt = (-kAΔT)/x and explain the variables they measured and what variables matter to heat flow. If this is being used as an introductory lesson, help students realize that equations are also another method for describing data. The equation is just another way to describe what has been observed with heat flow.
To end the lesson, discuss the desired format for writing in the classroom and give examples of how to write equations in papers and how to include and reference diagrams. At this point, expect students to feel comfortable creating write-ups of the associated activity’s lab that they just performed that would be clear to the average reader. As always, remind them to write as if the reader has never heard of the experiment, not to the teacher.
Attachments
Assessment
Pre-Lesson Assessment
Discussion Questions: Before showing the class the introductory Using Visual Art to Communicate Presentation, discuss the lesson topics, which are woven into the following questions. Listen to students’ answers and comments to determine their current thinking and familiarity with the concepts as well as to foreshadow the lesson topics.
- How can we show motion in images?
- Can art give us information?
- How do you communicate with art?
- Where do you use art to get information in your daily life?
- What are some words we can use to describe art?
- How might scientists and engineers use art to communicate ideas and information?
Lesson Summary Assessment
Evaluation of Lab Data: After completing the associated activity lab, have students discuss their findings and draw conclusions based on their data. Get students to think about ways to model their data, how to test other variables and other ways to design their own experiments. For AP students, have them write short responses to their labs similar to the paragraph-length free response to questions approach. Example questions include:
- What do you think affected your variables?
- How do different materials transfer heat differently? How do we account for that in the heat flow rate math equation?
- How would you test thickness? Temperature difference? Explain your setup.
- How could you do a mathematical model for your data?
Homework
Lab Write-Up: Students practice the writing skills discussed by creating lab write-ups that include diagrams using the “diagram design requirements” method that the class agreed to be the best (during the associated activity’s Procedure section). Grade their lab write-ups based on writing clarity, formatting, logic and organization/neatness, as well as the effectiveness of all visual presentation elements.
Additional Multimedia Support
A website that focuses on arts integration research, Harvard Graduate School of Education’s Project Zero: http://www.pz.harvard.edu/
Thermal Conduction. Khan Academy video explains the basics of heat transfer. [YouTube 7:15]
References
Contributors
Andrew Carnes, Satish Kumar, Jamila Cola, Baratunde Cola, ARTSNow, PRIME 2014 Fellows
Acknowledgements
This activity was developed by the Partnerships for Research, Innovation and Multi-Scale Engineering (PRIME) Research Experience for Teachers (RET) Program at Georgia Institute of Technology, funded by National Science Foundation RET grant no. EEC 140718.
Filed under: Class Activities, Grades 9-12, Grades 9-12, Lesson Plans
Tags: Art, Class Activities, diagram, experiment, Grades 9-12, graphic design, heat flow, Presentations, STEAM, Technical Communications, thermal imaging, writing