Lesson: Measuring Velocity
 (Lesson courtesy of Discovery Education)
Grade Level: 6-12. Time Required: one or two class periods. Group Size: 6 students.
DESCRIPTION:
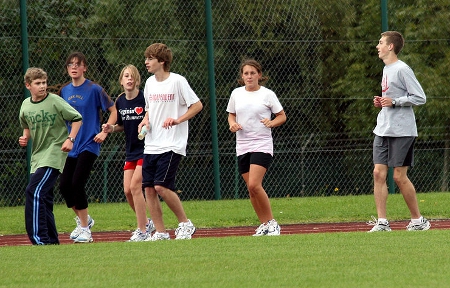
In this lesson, students learn how to make a graph to measure average velocity and calculate the mid-times for personal intervals of student runs, walks, and jogs. Working in groups, one member walks, jogs, or runs in a straight-line path while attempting to maintain a constant velocity. The other group members time the runner along the path, and then record and graph the data of each run.
OBJECTIVES
Students will:
- travel one at a time in a straight-line path, attempting to maintain a constant velocity;
- time other groups members’ attempts at five-meter intervals along the path; and
- record data for each student’s attempt.
STANDARDS
Science standards for grades 5-8:
- Science as Inquiry: Abilities necessary to do scientific inquiry, Understanding about scientific inquiry
- Physical Science: Motions and forces, Transfer of energy
- Measurement Standard: Understand measurable attributes of objects and units, systems and processes of measurement; Apply appropriate techniques, tools, and formulas to determine measurements
Science standards for grades 9-12:
- Science as Inquiry: Abilities necessary to do scientific inquiry, Understanding about scientific inquiry
- Physical Science: Motions and forces, Interactions of energy and matter
- Measurement Standard: Understand measurable attributes of objects and units, systems and processes of measurement; Apply appropriate techniques, tools, and formulas to determine measurements
Math standards for grades 9-12:
- Algebra Standard: Understand patterns, relations, and functions; represent and analyze mathematical situations and structures using algebraic symbols; use mathematical models to represent and understand quantitative relationships
- Measurement Standard: Understand measurable attributes of objects and the units, systems, and processes or measurement; apply appropriate techniques, tools, and formulas to determine measurements
MATERIALS
- Stopwatches
- Paper (graph and blank)
- Pencils or pens
- Markers or colored pencils
- Area for a 20-meter course
PROCEDURES
1. Divide the class into groups of around six students. Tell them that they will travel one at a time in a straight-line path and attempt to maintain a constant velocity. While one student walks, jogs, or runs, the other group members time the “runner” while standing at five-meter intervals along the path. One person in the group will record data from the timers immediately after each run.
 2. Have students practice until they get the hang of starting and stopping their stopwatches correctly. The goal is for everyone to simultaneously start timing when the runner starts, and then to individually stop when the runner passes their point along the path.
3. When students are ready, have them complete the experiment several times, changing positions so that each person gets to serve as a “runner” at least once.
4. Have each student make a distance/time graph — distance in meters on the vertical axis, and time in seconds on the horizontal axis — and graph their motions. Remind them to start at 0 seconds, 0 meters (the time they “passed” the starting line).
5. Now have them add the motions of two other people from their team to their individual graph, using different colors or other distinguishing marks.
6. Have them calculate the slopes for each interval of their graphs to determine their average velocities, as well as that of two other group members. They should record this information in a results table.
7. In addition, have them calculate the mid-time for each of their personal intervals using (t1+ t2)/2 and add the information to the results table.
8. Have students make a graph that shows average velocity (V) (vertical axis) versus mid-time velocity using the same scale along their time axis. They should not include a 0 meters/seconds, 0 seconds point on this graph, unless they tried to start with zero velocity.
9. Ask students to answer these questions:
• Was your velocity constant? Defend your answer. (Constant velocity is indicated by a straight line on the graph of d versus t.)
• Who moved the fastest?
• How did that person’s distance/time graph compare to the others?(Answer: The fastest traveler had the steepest slope.)
EVALUATION
Use the following three-point rubric to evaluate students’ work during this lesson.
Three points: Students worked cooperatively during the experiment; accurately created their graphs and made the calculations for their results table; answered the two final questions correctly.
Two points: Students worked somewhat cooperatively during the experiment; created graphs and made calculations for their results table that were reasonably accurate; answered one of the two final questions correctly.
One point: Students did not work cooperatively during the experiment; created graphs and made calculations for their results table that were inaccurate; could not answer either of the two final questions correctly.
VOCABULARY
average velocity
definition: an estimation in which the total distance an object travels is divided by the total time elapsed
context: To determine an interval’s average velocity, add its starting and ending velocity and then divide the sum in half.
constant velocity
definition: when an object moves the same distance in equal periods of time; an example of uniform motion
context: On a distance/time graph, a straight line represents constant velocity.
interval
definition: the space between two objects or points
context: during this experiment, you will time each other at five-meter intervals along the path.
Credits: Ann L. Hammersly, physics teacher, Chaparral High School, Scottsdale, Arizona
Additional resources: Virtual Car; Velocity and Acceleration from teachersdomain.org., including an interactive mapping activity, background, and discussion questions.
Filed under: Grades 6-8, Grades 9-12, Lesson Plans
Tags: Class Activities, Grades 6-12, Lesson Plan, Mathematics


